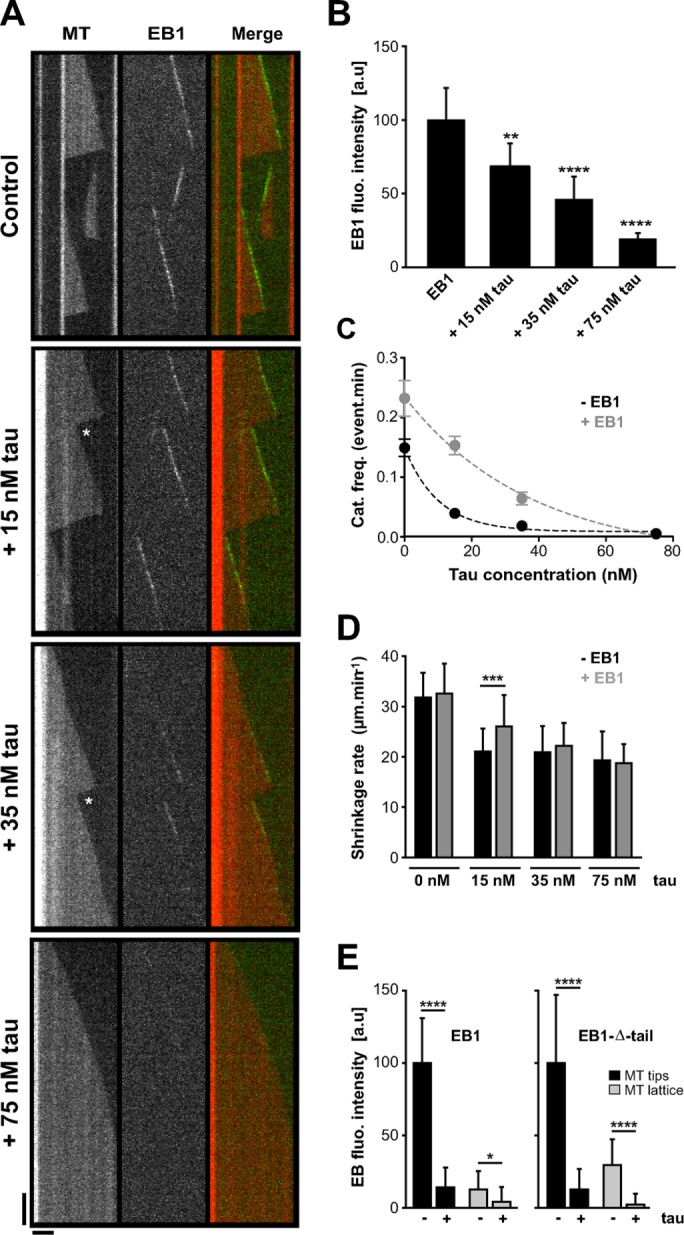
FIGURE 1:

Tau inhibits EB1 tracking at microtubule ends in a concentration-dependent manner. (A) Kymographs of microtubules assembled in the presence of 75 nM GFP-EB1 alone or with combinations of 75 nM GFP-EB1 and increasing concentrations of tau (15, 35, and 75 nM). The white stars indicate rescues after catastrophe events. Horizontal and vertical bars, 5 μm and 60 s, respectively. MT, microtubule. (B) Histogram indicating GFP-EB1 fluorescence intensity at microtubule tips in the absence or presence of increasing tau concentration. **p < 0.01, ****p < 0.0001 (Kruskal–Wallis analysis of variance [ANOVA] followed by post hoc Dunn’s comparison; n = 35, 75, 81, and 34 for GFP-EB1, GFP-EB1 + 15 nM tau, GFP-EB1 + 35 nM tau, and GFP-EB1 + 75 nM tau, respectively). The p values were calculated in comparison to the condition without tau. a.u., arbitrary units. (C) Catastrophe frequency vs. tau concentration in the absence (black) or presence (gray) of GFP-EB1. Data were fitted by a one-phase exponential decay model (R2 = 0.99 for both data sets), and the two curves were significantly different with p = 0.02 (F-test). (D) Microtubule shrinkage rates measured with or without GFP-EB1 (75 nM) and at increasing tau concentrations (0, 15, 35, and 75 nM). ***p < 0.001 (Mann–Whitney U test, n = 22 and 104 for tau 15 nM and tau 15 nM + GFP-EB1, respectively). (E) Histograms showing GFP-EB1 (left) and GFP-EB1-Δ-tail (right) fluorescence intensity at microtubule tips and on the microtubule lattice in the presence or absence of tau. Equimolar concentrations (75 nM) of GFP-EB1, GFP-EB1-Δ-tail, and tau were used. *p < 0.05, ****p < 0.0001 (Mann–Whitney U test comparison, n = 20 for each condition). All error bars represent SDs.
