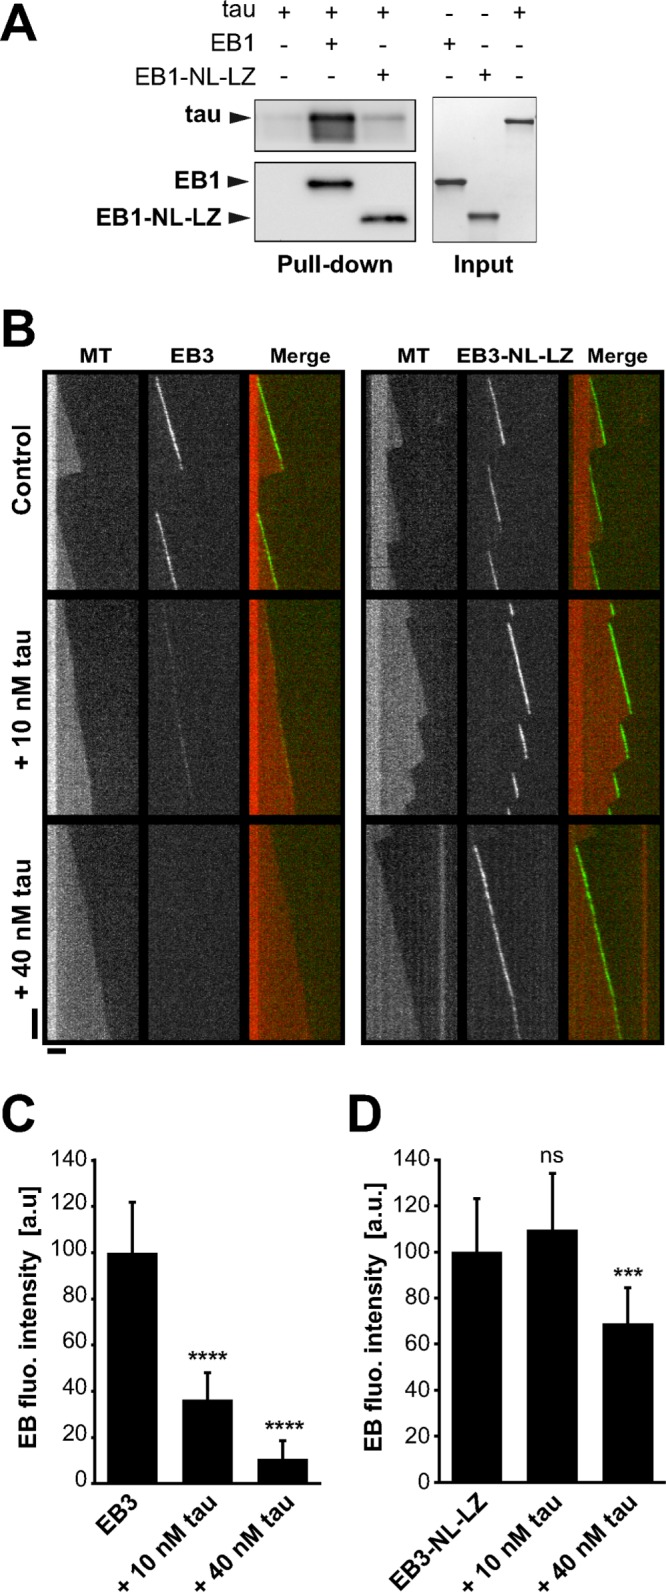
FIGURE 3:

Tau inhibitory effect on microtubule-tracking properties of EBs requires the C-terminal part of EBs. (A) Pull-down assays of tau with biotinylated-EB1 or biotinylated-EB1-NL-LZ. (B) Kymographs of microtubules assembled with 10 nM GFP-EB3 (left) or GFP-EB3-NL-LZ (right) in the absence (control) or presence of increasing concentrations of tau. Protein concentrations were decreased compared with conditions with GFP-EB1 and tau (Figure 1) to avoid GFP-EB3-NL-LZ binding to the microtubule lattice. Horizontal and vertical bars, 5 μm and 60 s, respectively. MT, microtubule. (C, D) Fluorescence intensity of GFP-EB3 (C) and GFP-EB3-NL-LZ (D) comets in the absence or presence of increasing concentrations of tau. ***p < 0.001; ****p < 0.0001; ns, nonsignificant; nonparametric Kruskal–Wallis ANOVA followed by post hoc Dunn’s comparison (42, 37, and 48 microtubules for EB3, EB3 + 10 nM tau, and EB3 + 40 nM tau, respectively; 22, 40, and 30 microtubules for EB3-NL-LZ, EB3-NL-LZ + 10 nM tau, and EB3-NL-LZ + 40 nM tau, respectively). The p values were calculated in comparison to the conditions without tau. All error bars represent SD. a.u., arbitrary units.
