FIGURE 5:
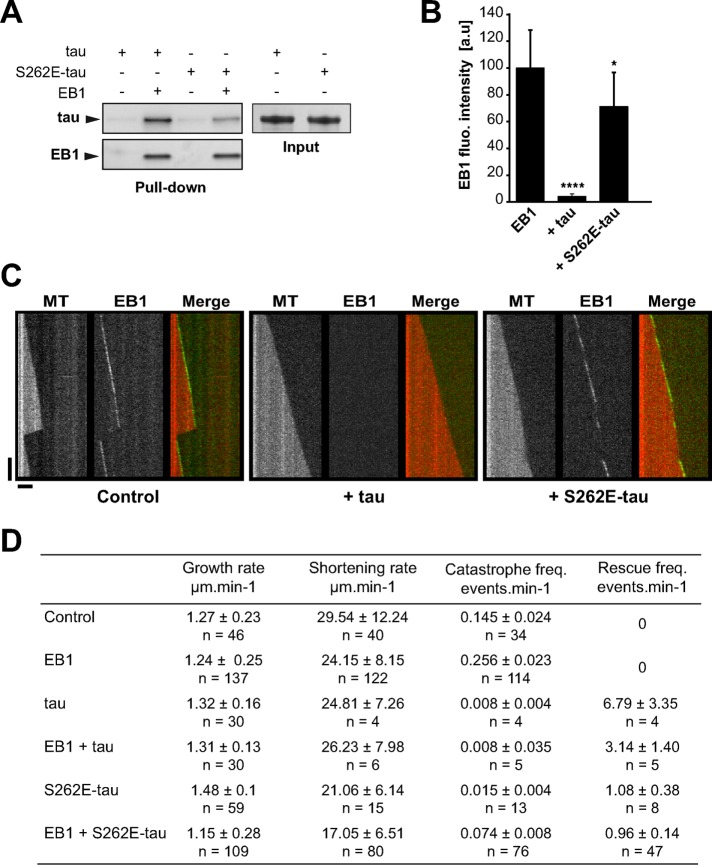
S262E-tau interacts weakly with EB1 and does not inhibit EB1 tracking at microtubule ends. (A) Pull-down assays of tau and S262E-tau with biotinylated-EB1. One representative experiment. Quantifications indicate a decrease of 50.1% ± 15.8 of S262E-tau bound to EB1 compared with tau (three independent experiments, mean ± SD). (B) Quantification of fluorescence intensity of EB1 comets in the presence of tau or S262E-tau. *p < 0.05, ****p < 0.0001, nonparametric Kruskal–Wallis ANOVA followed by post hoc Dunn’s comparison (37, 25, and 26 microtubules for EB1, EB1 + tau, and EB1 + S262E-tau, respectively). The p values were calculated in comparison to the condition without tau. Error bars represent SD. a.u., arbitrary units. (C) Kymographs of microtubules assembled with 75 nM GFP-EB1 in the absence (control) or presence of 75 nM of tau (+ tau) or S262E-tau (+ S262E-tau). Horizontal and vertical bars, 5 μm and 60 s, respectively. MT, microtubule. (D) Microtubule dynamics for tubulin alone (control) or in the presence of EB1, tau, S262E-tau, EB1 + tau, or EB1 + S262E-tau. The total times of measurements were 233.14, 444.28, 487.57, 567.19, 821.12, and 1014.26 min for tubulin alone, EB1, tau, EB1 + tau, S262E-tau, and EB1+S262E-tau, respectively. n, number of events measured for each condition. Values represent the mean ± SD.

