FIGURE 6:
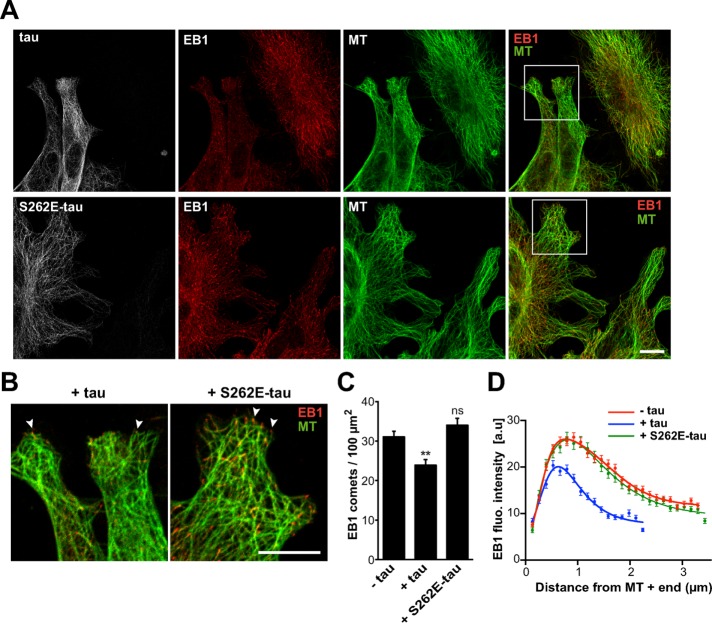
S262E-tau does not inhibit endogenous EB1 localization at microtubule ends. (A) Mouse embryonic fibroblasts were transfected with either pcDNA-tau (tau, top) or pcDNA-S262E-tau (S262E-tau, bottom) and stained for tau (gray), EB1 (red), and tubulin (MT, green). Right, merged images with EB1 and tubulin staining. Images include nontransfected and transfected cells in the same field. Bar, 10 μm. MT, microtubule. (B) Higher magnifications of cells transfected with pcDNA-tau (+tau) and pcDNA-S262E-tau (+S262E-tau). Arrowheads point to EB1 comets. Bar, 10 μm. (C) EB1 comet density normalized to the microtubule network surface (comet number/100 μm2 of microtubule network) in lamellipodia of nontransfected cells (−tau) and cells transfected with tau (+tau) or S262E-tau (+S262E-tau). The histogram shows the mean ± SEM. **p < 0.01; ns, nonsignificant; nonparametric Kruskal–Wallis ANOVA followed by post hoc Dunn’s comparison (74, 46, and 52 regions of interest for –tau, +tau, and +S262E-tau conditions, respectively). The p values were calculated in comparison to the condition without tau. (D) The fluorescence intensity of comets was quantified in nontransfected (−tau) and transfected cells (+tau and +S262E-tau) and plotted against distance from microtubule plus ends. Nonlinear regression curves fitting the mean fluorescence intensities ± SEM (247, 177, and 132 comets for –tau, +tau, and +S262E-tau cells, respectively). a.u., arbitrary units.

