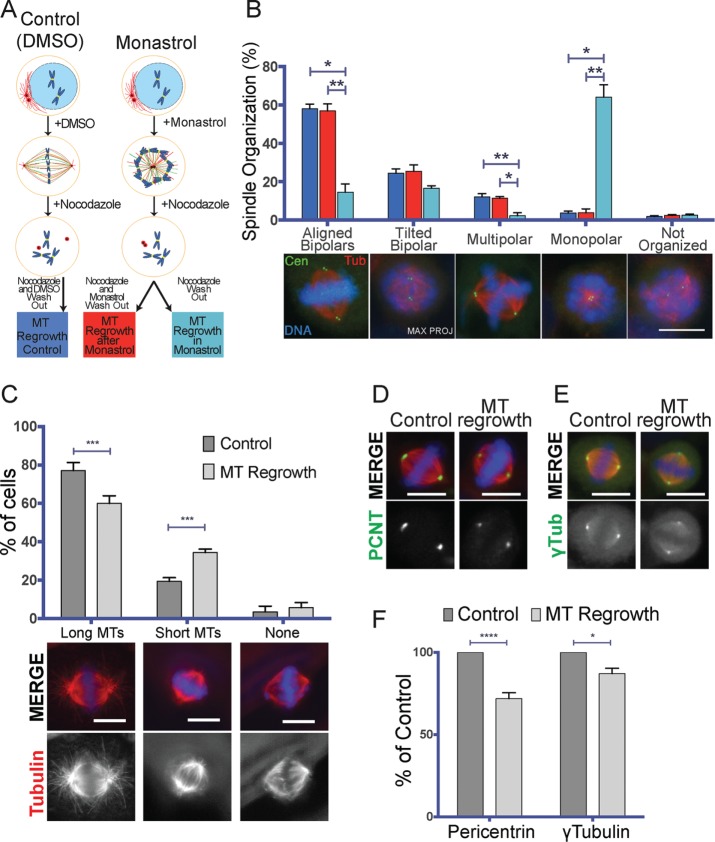
FIGURE 2:
The spindle assembly defects observed upon nocodazole washout are not directly related to centrosome positioning, whereas they correlate with lower levels of PCM components at the centrosomes. (A) Experimental design of the experiments shown in B. (B) Spindle organization in cells preincubated in DMSO (MT Regrowth Control, blue) or monastrol followed by nocodazole incubation and washout in the absence (MT Regrowth after Monastrol, red) or presence of monastrol (MT Regrowth in Monastrol, cyan). Proportion of different spindle organizations 30 min after nocodazole washout. Representative IF images of different spindle organizations are shown below the graph. Data from 694 control cells, 672 MT regrowth after monastrol cells, and 630 MT regrowth in monastrol cells from three independent experiments, counting in each at least 200 cells/condition. DNA is in blue, centrin in green, and tubulin in red. Scale bar, 10 μm. Error bars, SEM. *p < 0.05; **p < 0.01. (C) Cells undergoing MT regrowth form astral MTs less efficiently. Quantification of the proportion of control cells (dark gray) and MT regrowth–treated cells (light gray) having long astral MTs (Long MTs), short astral MTs (Short MTs), or no detectable astral MT (None). Representative IF images of different spindle organizations are shown below the graph. Data from 854 control cells and 802 MT regrowth cells from four independent experiments, counting in each at least 200 cells/condition. DNA is in blue, centrin in green, and tubulin in red. Scale bar, 10 μm. Error bars, SEM. ***p < 0.001. (D) On MT regrowth, centrosomes recruit less pericentrin. Representative IF images of two spindles assembled in control cells or in MT regrowth–treated cells. DNA is in blue, pericentrin in green, and tubulin in red. The pericentrin staining is reported also in gray scale. Scale bar, 10 μm. (E) On MT regrowth, centrosomes recruit less γ-tubulin. Representative IF images of two spindles assembled in control cells or in MT regrowth–treated cells. DNA is in blue, γ-tubulin in green, and tubulin in red. The γ-tubulin staining is reported also in gray scale. Scale bar, 10 μm. (F) Quantification of the pericentrin and γ-tubulin signal to the mitotic centrosomes of control cells (dark gray) and MT regrowth–treated cells (light gray). The signals of both proteins are significantly reduced in MT regrowth–treated cells. Data from 370 cells for pericentrin control, 371 cells for pericentrin MT regrowth, 371 cells for γ-tubulin control, and 363 cells for γ-tubulin MT regrowth from six independent experiments, counting in each at least 50 cells/condition. Error bars, SEM. *p < 0.05; ****p < 0.0001.

