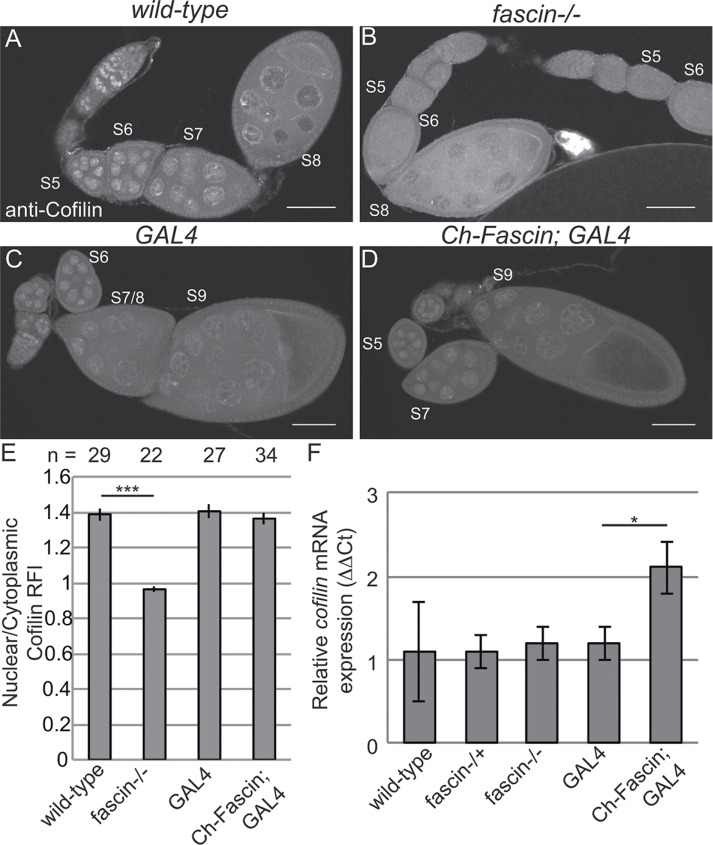
FIGURE 9:
Loss of Fascin reduces nuclear Cofilin levels. (A–D) Maximum projections of two to four confocal slices of follicles of the indicated genotypes stained for Cofilin; note that these are the same follicles shown in Figure 8. Scale bars, 50 μm. (E) Chart depicting the average nuclear-to-cytoplasmic relative fluorescence intensity of Cofilin in nurse cells from S7–8 follicles; the number of nurse cells (n) examined is indicated across the top of the chart. Briefly, the fluorescence intensity along a line traversing from the cytoplasm into the nucleus from two to three nurse cells from a minimum of seven different follicles from each genotype, in a genotypically blinded manner, was analyzed as described in Materials and Methods. Loss of Fascin significantly reduced the nuclear level of Cofilin, whereas overexpression of Fascin did not alter the distribution of Cofilin. Error bars, SE. ***p < 0.001, unpaired t test with Welch’s correction. (F) Chart depicting the normalized mRNA expression of cofilin from whole ovary preparations. Error bars, SE. Reduction of Fascin expression does not alter cofilin expression relative to wild-type. Overexpression of Fascin results in a significant increase in cofilin expression relative to its GAL4 control (Ch-Fascin to GAL4, p < 0.05, unpaired t test with Welch’s correction).

