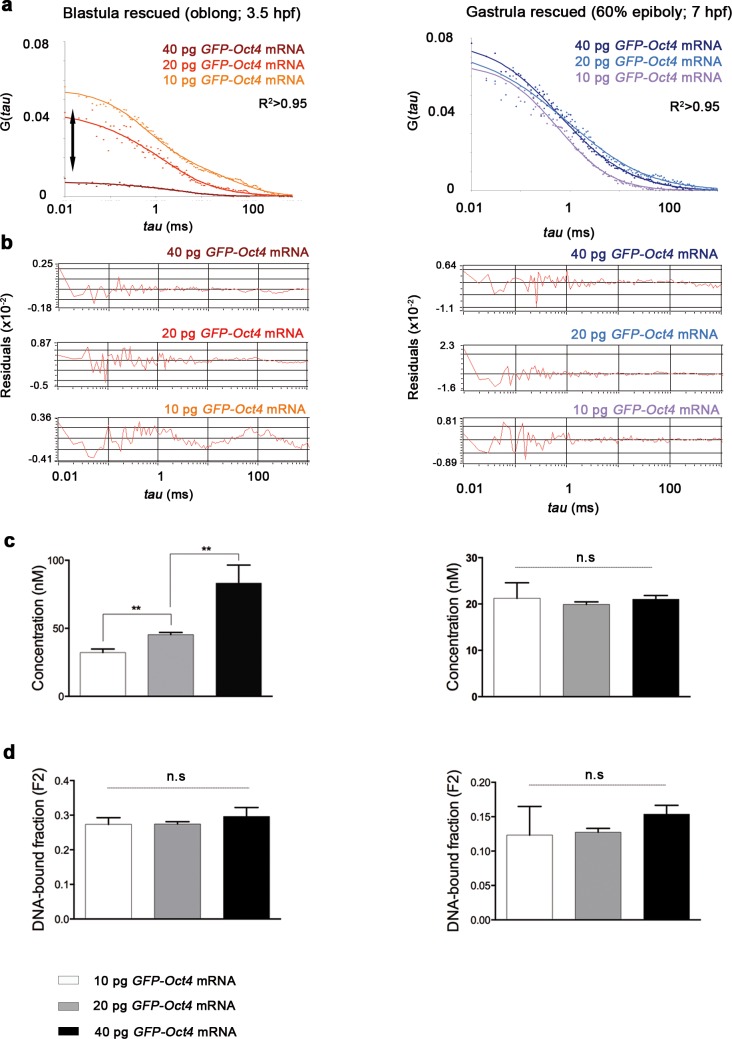
Figure 1. Oct4 DNA-bound active fraction controls zebrafish gastrulation.
(a) Schematic diagram of fluorescence correlation spectroscopy (FCS). GFP-tagged nuclear protein is localized in the nucleus of embryonic cells. Fluorescence molecules diffuse through a confocal volume (<1 μm3) within a single-cell nucleus and generate fluctuating fluorescence intensity. The autocorrelation function (ACF) of the fluctuation is fit to obtain the absolute protein concentration (C) and the diffusion coefficient (D), where N is the number of molecules. Scale bar: 10 μm. (b) Lateral view of pou5f3 morphant embryos expressing GFP-Oct4 rescued by GFP-Oct4 mRNA at the blastula [3.5 hr post-fertilization (hpf)] and gastrula (7 hpf) stages and non-rescued embryos (arrested) at the blastula stage. The non-rescued embryos also express GFP-Oct4 but remain at the blastula stage and do not develop further. Scale bar: 200 μm. (c) ACF of the intensity traces of GFP-Oct4 and GFP-Oct4ΔHD in rescued and non-rescued embryos at the blastula stage. The ACF were fit by two-component anomalous diffusion model. Curves are normalized to compare differences in protein activity (indicated by arrows). (d) Raw data of residuals from fit curves shown in c. (e) Concentration and DNA-bound fraction levels derived from the FCS measurements in c. Values represent the mean ± SEM of data from three to five independent experiments (n = 39–125 cell nuclei from 10 to 15 embryos ****p<0.0001; **p<0.01). n.s. over bars indicates non-significant differences. See also Figure 1—figure supplements 1–3, Figure 1—source data 1 and Materials and methods.
DOI: http://dx.doi.org/10.7554/eLife.11475.003


