. 2016 Sep 29;5:e11475. doi: 10.7554/eLife.11475

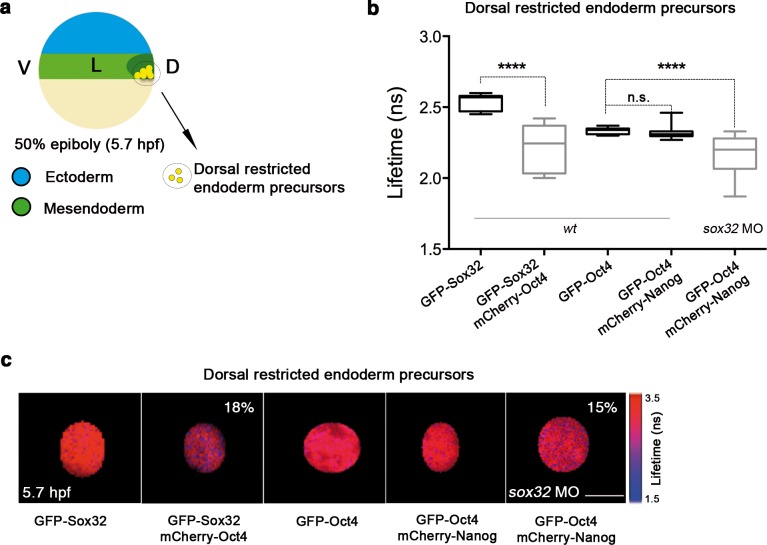
Figure 5. Sox32 competes with Nanog for Oct4 binding at dorsal endoderm of gastrula embryos.

(a) The schematic shows the main germ layers of the embryo at 50% epiboly (5.7 hpf) with ectoderm in blue and mesendoderm in green. The dorsal-restricted endoderm precursors are shown in yellow. (b, c) Lifetime values (b) and FLIM images (c) of GFP-Sox32 and GFP-Oct4 alone and in the presence of mCherry-Oct4 and mCherry-Nanog, respectively, in the nuclei of individual cells of dorsal endoderm precursors. Scale bar: 5 µm values represent the median and quartile ranges of data from three to five independent experiments (= 20–30 cell nuclei from 10 embryos; ****p<0.0001). See also Figure 5—figure supplement 2, Figure 5—source data 1.

DOI: http://dx.doi.org/10.7554/eLife.11475.021

Figure 5—source data 1. FCCS parameters of GFP-Sox32 and mCherry-Nanog in endoderm of gastrula embryos (50% epiboly; 5.7 hpf).
Diffusion parameters were derived from analysis of FCCS data with the ACFs and CCF fit by two-component anomalous diffusion model. D1, D2: Diffusion coefficients of the fast and slow diffusion components, respectively. α1, α2: anomalous parameters of the fast and slow diffusion components, respectively. Kd: dissociation constant at equilibrium; values were obtained from the slopes of the fitted linear line when plotting the concentration of GFP-Sox32 (CS) * concentration of mCherry-Nanog (CN) versus the concentration of the proteins association (CSN). If the proteins are associated, there will be a linear line; in cases where no association exists, there is no linear relationship. Association: fraction of proteins diffusing together in the same complex. Details of the FCCS analysis are explained in the Materials and methods. D-E: dorsal endoderm; V-E: ventral endoderm; Values represent mean ± SEM from three to five independent experiments with > 15.
DOI: 10.7554/eLife.11475.022

Figure 5.

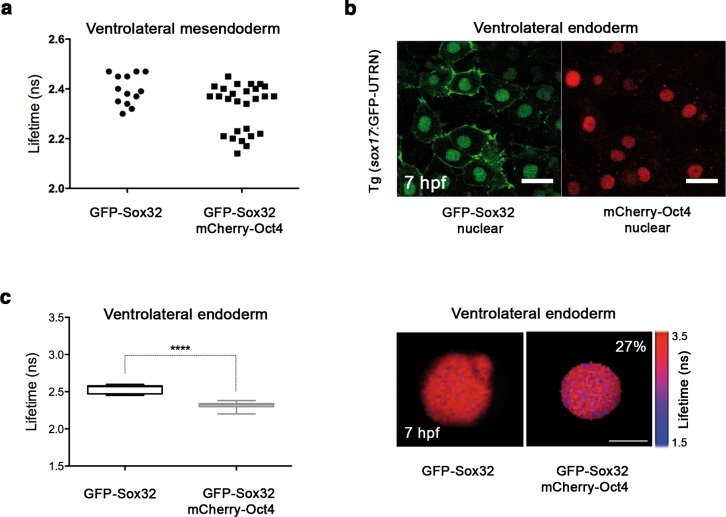
Figure 5—figure supplement 1. Sox32 binds Oct4 in ventrolateral endoderm.

Figure 5—figure supplement 1.

Lifetime values of GFP-Sox32 lifetime alone and co-expressed with mCherry-Oct4 in the nuclei of individual cells from the row next to the margin in ventrolateral mesendoderm at 50% epiboly (5.7 hpf) before involution starts. Those showing a decrease in the lifetime are endoderm precursors and those with similar lifetime are mesoderm precursors. (b) GFP-Sox32 and mCherry-Oct4 co-expressed in Tg(sox17:GFP-UTRN) embryos at 60% epiboly (7 hpf). Scale bar: 20 μm. (c) Lifetime values and FLIM images of GFP-Sox32 lifetime alone and co-expressed with mCherry-Oct4 in the nuclei of individual cells in ventrolateral endoderm at 60% epiboly (7 hpf). The percentage of binding is indicated at the top right corner of the FLIM image. Values represent the median and quartile ranges of data from three independent experiments (= 20–30 cell nuclei from 10 embryos; ****p<0.0001). Scale bar: 5 μm.
Figure 5—figure supplement 2. Nanog and Sox32 interact in endoderm.

Figure 5—figure supplement 2.

(a, b) ACFs and CCFs of the intensity traces of GFP-Sox32 co-expressed with mCherry-Nanog in (a) the dorsal endoderm precursors at 50% epiboly (5.7 hpf) and (b) in ventrolateral endoderm cells in Tg(sox17:GFP-UTRN) embryos at 60% epiboly (7 hpf) fit by two-component anomalous diffusion model. (c, d) Raw data of residuals from fit curves shown in a, b, respectively. (e) Kd plots for GFP-Sox32 and mCherry-Nanog associations. Kd values were obtained from the slopes of the fitted linear line. If the proteins are associated, there will be a linear line when plotting the concentration of GFP-Sox32 (CS) * concentration of mCherry-Nanog (CN) versus the concentration of the protein association (CSN), since Kd represents the constant of the association at equilibrium. There is no linear relationship in cases where there is no association. Association: fraction of proteins diffusing together in the same complex. (f) Lifetime values of GFP-Sox32 lifetime alone and co-expressed with mCherry-Nanog in the nuclei of individual cells of dorsal and ventrolateral endoderm at the stages previously described. Values represent the median and quartile ranges of data from three independent experiments (= 20–30 cell nuclei from 10 embryos; **p<0.01; ***p<0.001). See also Figure 5—source data 1.