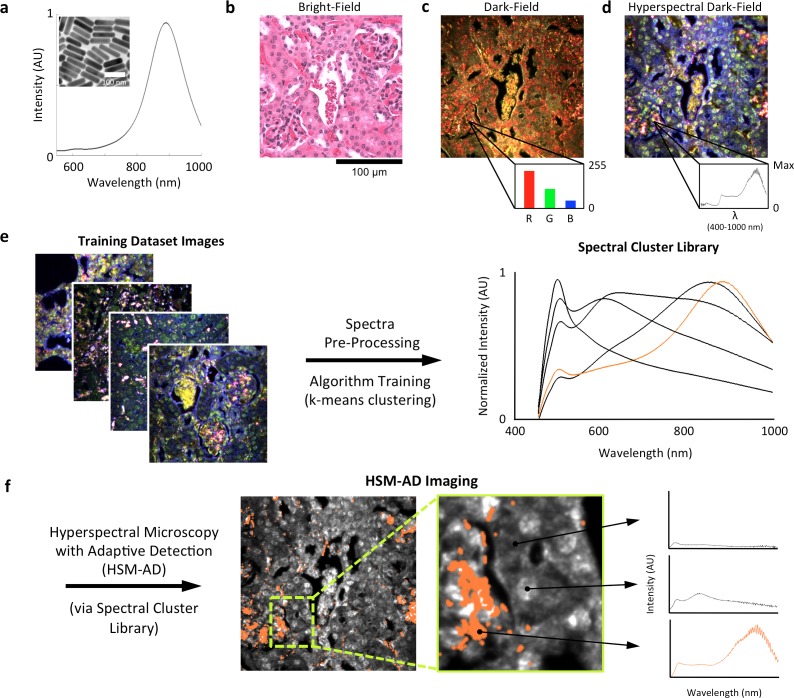
Figure 1. Overview of nanoparticle biodistribution analysis with HSM-AD.
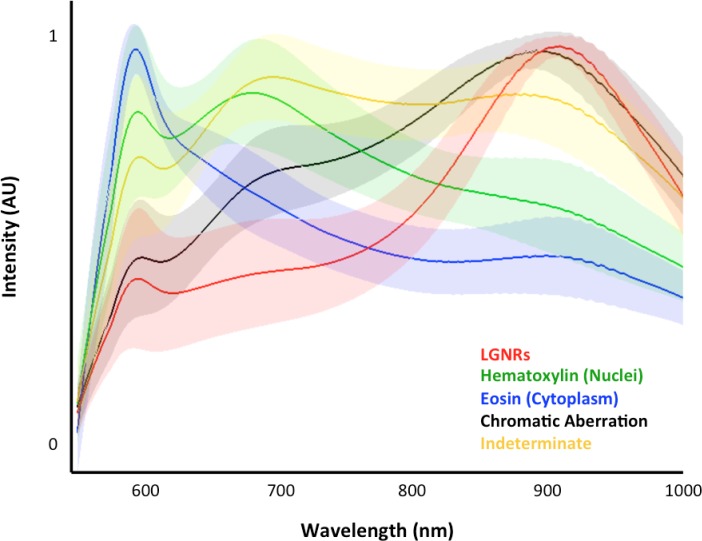
(a) Large gold nanorods (LGNRs, ~100 × 30 nm) exhibiting near infrared plasmon resonance were synthesized, functionalized, and intravenously injected into live nude mice. (b,c) 24 hr post-injection, the animals were euthanized and tissues were resected and prepared as normal histological sections for characterization with bright-field (b) and dark-field microscopy (c) neither of which was able to visualize the distribution of the LGNRs. (d) The same section was then imaged with hyperspectral microscopy, which showed clear signs of LGNRs accumulation (denoted by red hues) in various areas of the tissue and exhibited spectral peaks matching the LGNR plasmon resonance. (e) We then trained an adaptive clustering algorithm for spectral identification of LGNRs with hyperspectral images from injected mice. The algorithm identified several characteristic spectra representing the tissue and the H&E staining, as well as one unique spectrum representing the LGNRs (depicted in orange), altogether representing a library of 5 spectra. Once a spectral cluster library is produced from the training dataset, images of unknown tissue samples can by analyzed for the presence of LGNRs via automated classification. (f) The resulting HSM-AD images depict the location of all points within the sample that exhibit the LGNR spectrum (orange for LGNRs, grayscale for tissue).
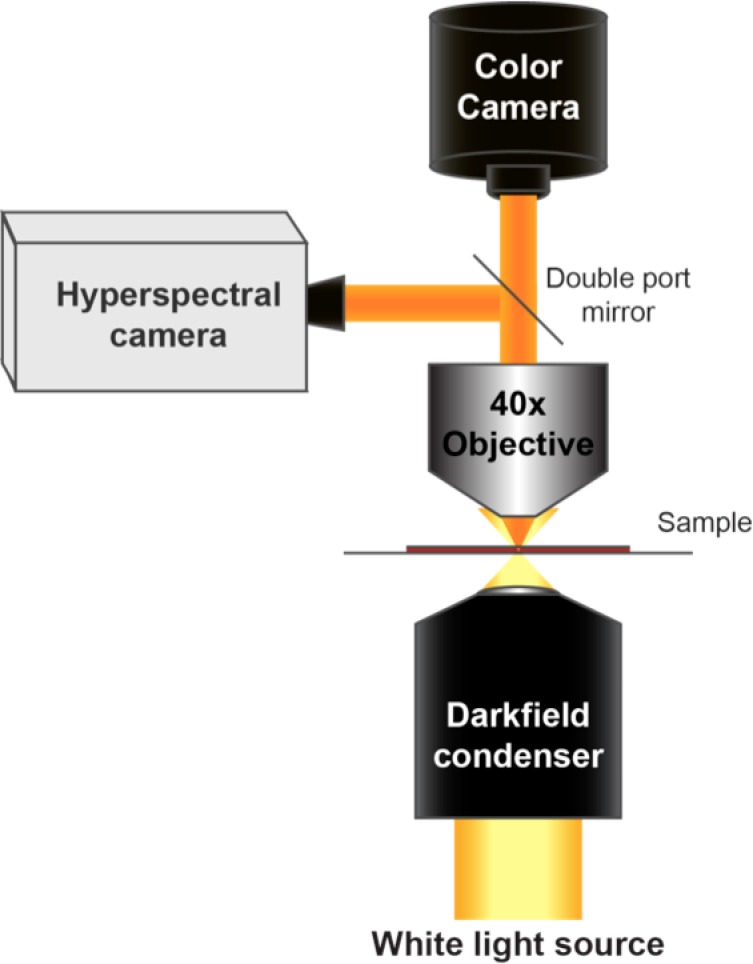
Figure 1—figure supplement 1. Diagram of the CytoViva microscope used for dark-field and hyperspectral image acquisition.
