. 2016 Aug 18;5:e16352. doi: 10.7554/eLife.16352

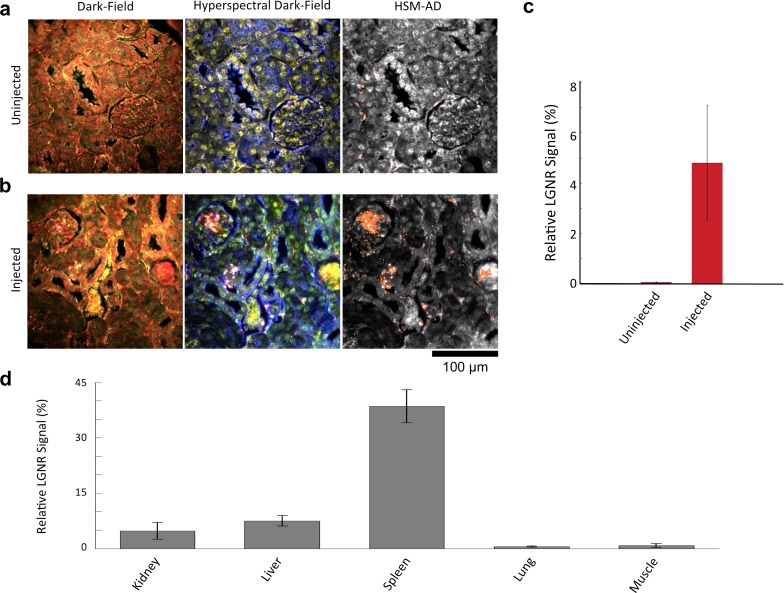
Figure 2. Sensitivity and specificity validation of HSM-AD.

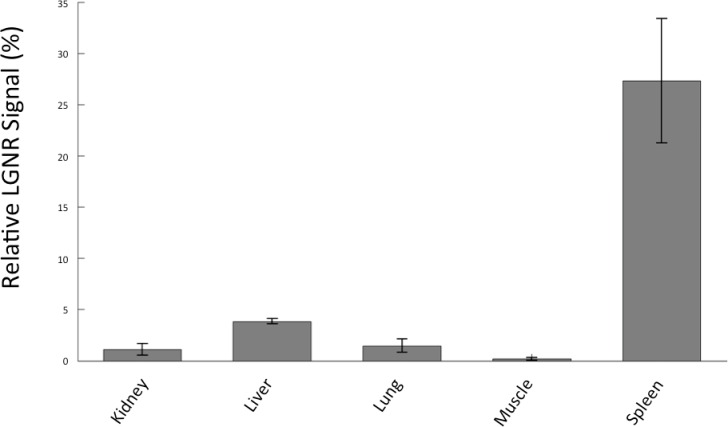
(a,b) Hematoxylin and Eosin (H&E) stained tissue samples (kidney) from uninjected (a) and injected (b) mice were imaged using dark-field and hyperspectral microscopy at 40x magnification and analyzed with HSM-AD to measure LGNR detection specificity and sensitivity. Conventional dark-field images highlight features including nuclei (salmon-pink), cytoplasm (green-brown), and erythrocytes (yellow-orange) within the tissues, but they reveal little information regarding the presence or absence of LGNRs. By comparison, putative LGNRs can be roughly identified as red-orange pixels in false-colored hyperspectral images, while nuclei and cytoplasm appear in green and indigo, respectively. (c) HSM-AD analysis of hyperspectral images demonstrates the absence of LGNRs in uninjected tissues and LGNR presence in injected samples (two-tailed Student’s t-test, p=0.054). Quantification of the relative LGNR signal from n = 4 tissue slices (representing a total of 1.04 million pixels) indicates that the false positive rate for LGNR detection (determined from uninjected tissues) is minimal. A detection specificity of 99.7% was determined from uninjected tissue sections, and a detection sensitivity of 99.4% was measured from samples of pure LGNRs analyzed using HSM-AD (Figure 2—figure supplement 1). (d) HSM-AD analysis of whole tissue sections (n = 4 for each tissue type) reveals quantitative differences in bulk LGNR uptake among various organs, in a manner analogous to conventional biodistribution methods. Quantitative data are presented as mean ± standard error of the mean (s.e.m.).

DOI: http://dx.doi.org/10.7554/eLife.16352.008

Figure 2—source data 1. Data used for diagnostic and 95% CIs.
DOI: 10.7554/eLife.16352.009
Figure 2—source data 2. Data for whole organ uptake quantification.
DOI: 10.7554/eLife.16352.010

Figure 2.

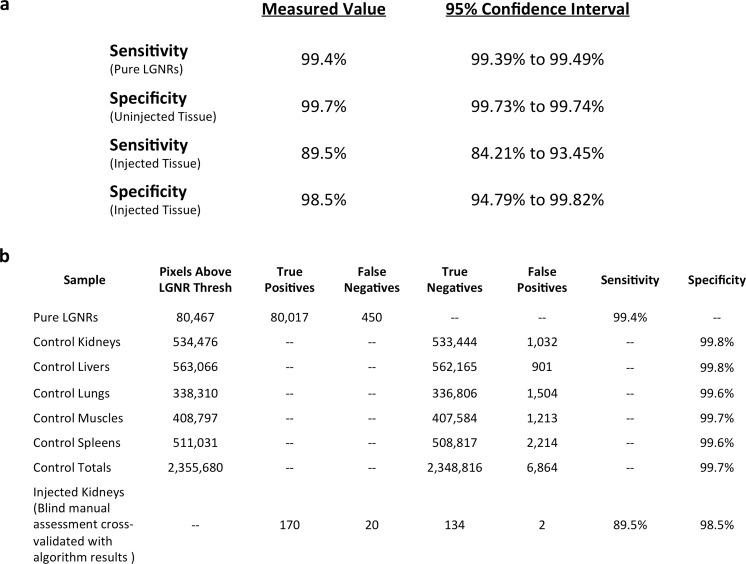
Figure 2—figure supplement 1. Measured sensitivity and specificity values for HSM-AD method.

Figure 2—figure supplement 1.

(a) Sensitivity values were calculated from pure LGNR samples in CytoSeal on a microscope slide and from blinded manual identification of LGNR spectra from injected sections cross-referenced with algorithm results. Specificity values were calculated directly from uninjected (LGNR-) tissue samples and from blinded manual identification of non-LGNR spectra cross-referenced with algorithm results. 95% confidence intervals were calculated for each sensitivity and specificity measurement. (b) Summary of raw data (pixel counts) for each measurement reported in (a).
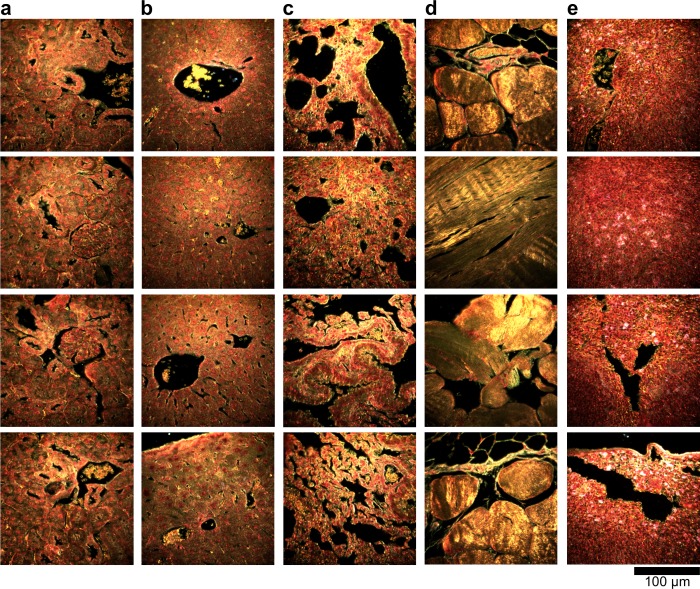
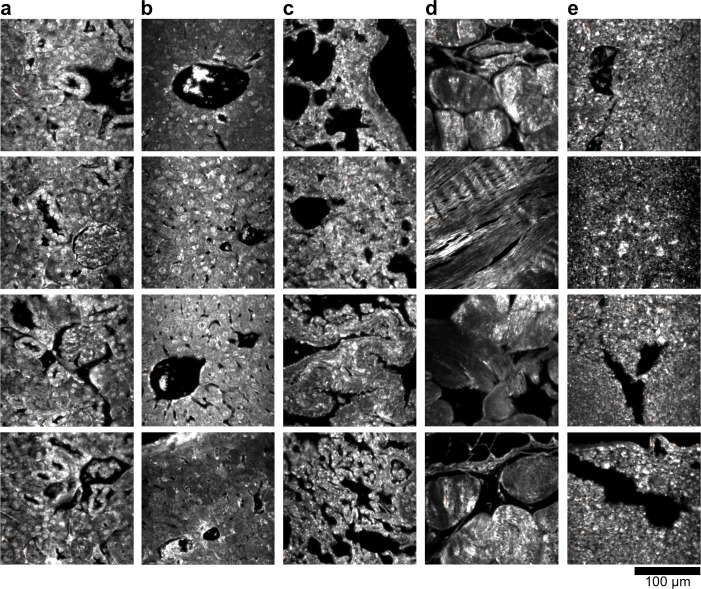
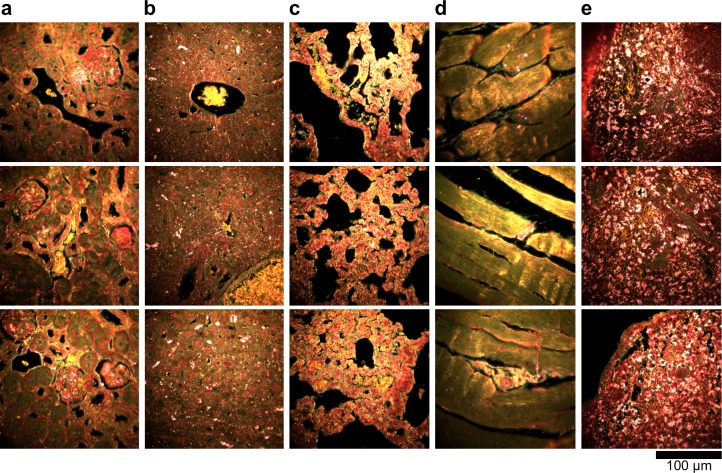
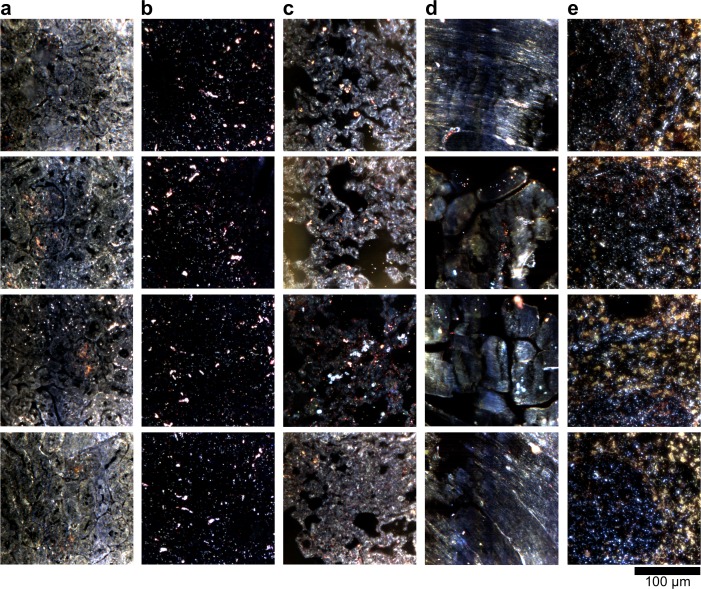
Figure 2—figure supplement 2. Dark-field images of additional uninjected H&E-stained tissue sections.

Figure 2—figure supplement 2.

(a) kidney, (b) liver, (c) lung, (d) muscle, and (e) spleen.
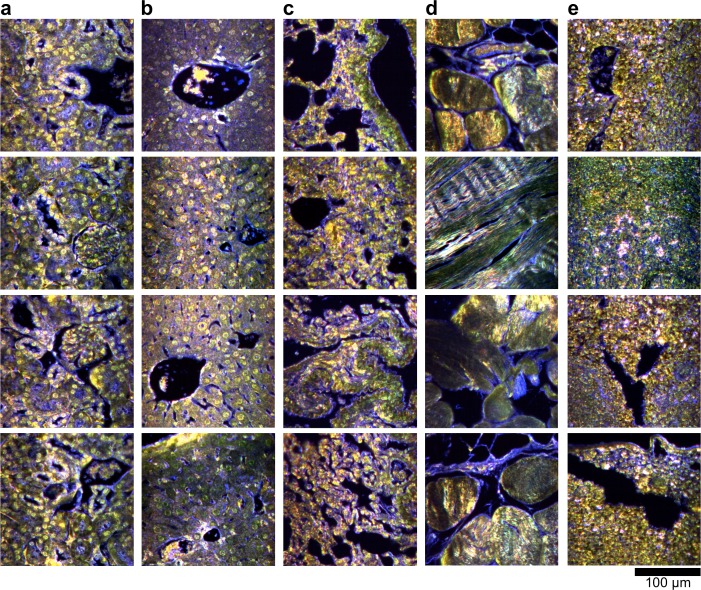
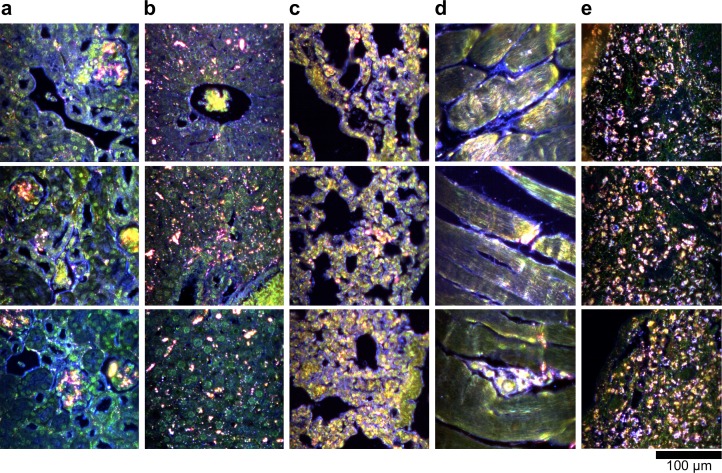
Figure 2—figure supplement 3. Hyperspectral images of additional uninjected H&E-stained tissue sections.

Figure 2—figure supplement 3.

(a) kidney, (b) liver, (c) lung, (d) muscle, and (e) spleen.
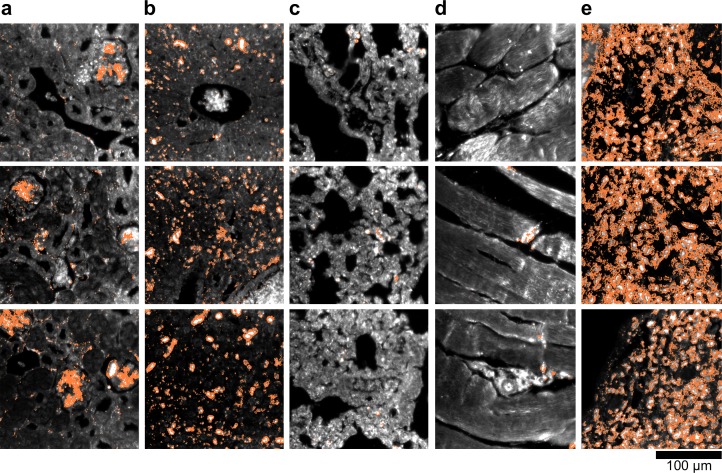
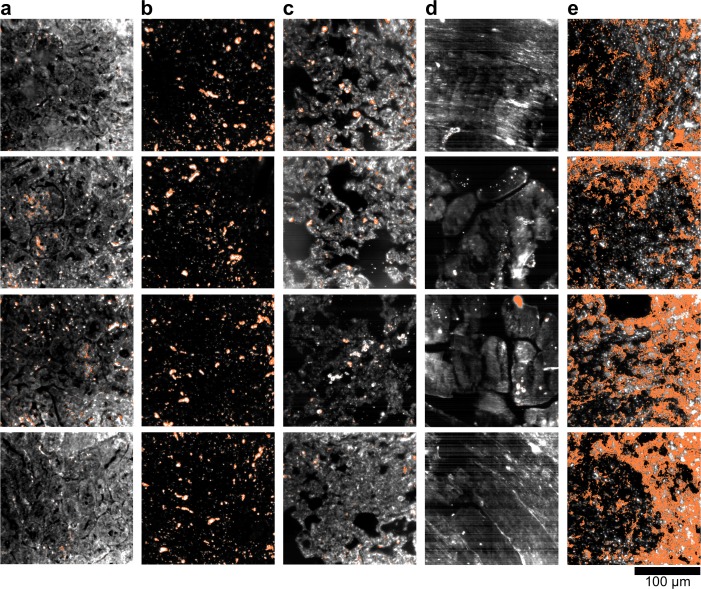
Figure 2—figure supplement 4. HSM-AD detection of additional uninjected H&E-stained tissue sections.

Figure 2—figure supplement 4.

(a) kidney, (b) liver, (c) lung, (d) muscle, and (e) spleen. Pixels identified as LGNR+ are denoted in orange. These analyzed samples were used for calculations of detection specificity.
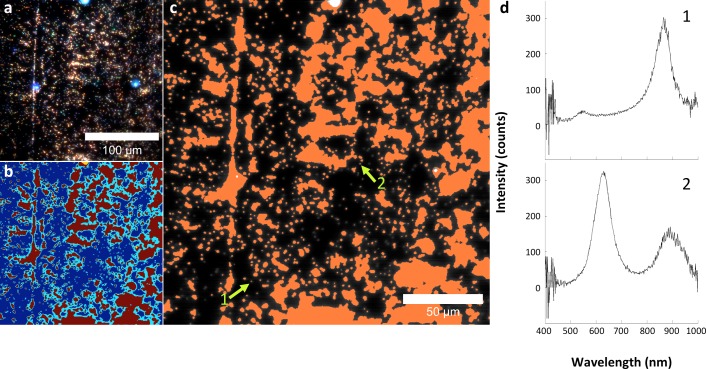
Figure 2—figure supplement 5. Analysis of LGNRs on a glass slide.

Figure 2—figure supplement 5.

(a) Hyperspectral image of LGNRs embedded in CytoSeal on a glass slide. (b) a segmentation map showing background in blue & cyan, high-intensity LGNR- pixels in yellow, and LGNR+ pixels in red. (c) HSM-AD detection of the LGNR sample demonstrated high detection sensitivity. (d) Inspection of individual LGNR+ and LGNR- pixels validates the detection efficacy of HSM-AD. The split-peak spectrum of pixel 2, which is not identified as LGNR+, is possibly indicative of LGNR surface plasmon resonance hybridization.
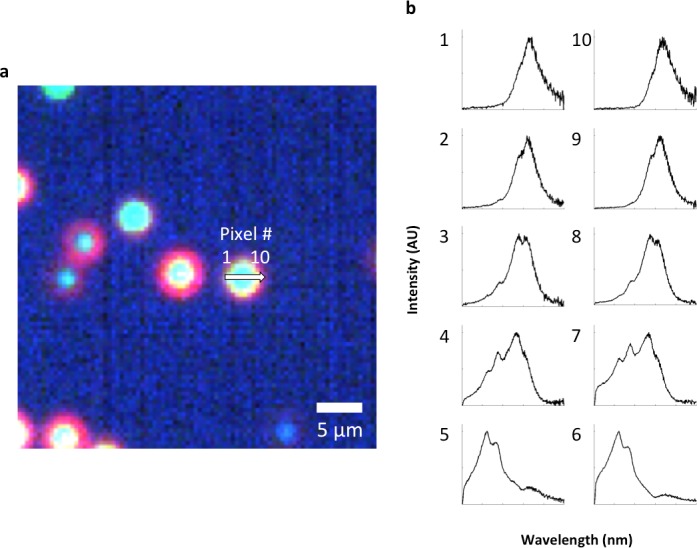
Figure 2—figure supplement 6. Spectral hybridization in partially aggregated LGNRs.

Figure 2—figure supplement 6.

(a) A sample of as-synthesized LGNRs (without additional surface functionalization) was centrifuged and resuspended to produce a sample with partial aggregation and imaged in water with the hyperspectral dark-field microscope. (b) Spectra from various distances from the aggregate center. Spectra from pixels near the edges of particle aggregates displayed scattering peaks similar to disperse LGNRs, while pixels closer to the centers of aggregates exhibited both blue-shifting and multiple spectral peaks.
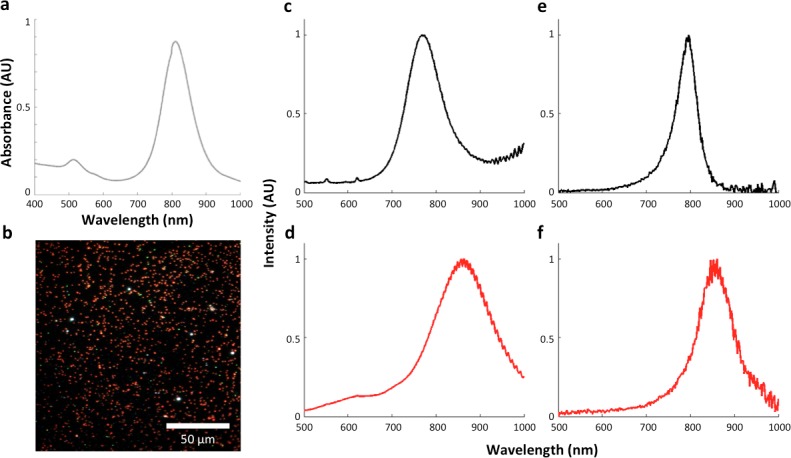
Figure 2—figure supplement 7. The influence of the local refractive index on the observed LGNR spectral peak.

Figure 2—figure supplement 7.

(a) LGNRs exhibited a spectral peak of ~800 nm when measured as a suspension in pure water with visible/near-infrared spectrometry. (b) Dark-field image of LGNRs in water. (c) The average spectrum of LGNRs in water has a peak that is slightly blue-shifted compared to the peak observed by spectrometry (a). (d) The average spectrum of LGNRs in CytoSeal (n = 1.5, matched to microscope immersion oil) produced a red-shift of ~80 nm in the average LGNR spectrum. (e) The spectrum of a single LGNR in water shows a similar peak to the average spectrum of LGNRs in water (c). (f) The spectrum of a single LGNR in CytoSeal shows a similar peak to the average spectrum of LGNRs in CytoSeal (d).
Figure 2—figure supplement 8. Evidence for single particle detection sensitivity with HSM-AD.

Figure 2—figure supplement 8.

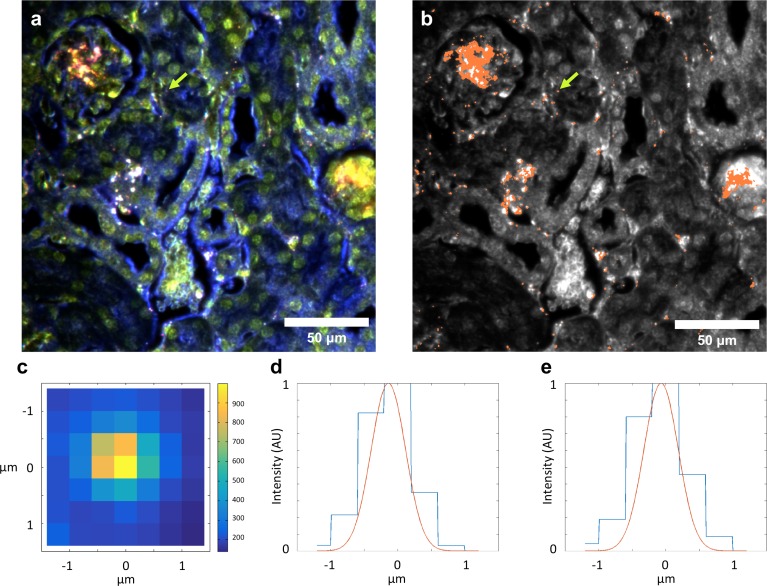
(a, b) Hyperspectral dark-field image (a) and HSM-AD detection (b) of a tissue section which includes presumed single LGNRs, such as the point indicated by the green arrow. (c) A 2D plot of the scattering intensity around the LGNR intensity peak (~900 nm) of pixels in the vicinity of the LGNR+ pixel shown in (b). (d, e) 1D plots of normalized pixel intensity as a function of distance from the center pixel (blue traces) and theoretical intensity profiles of a point scatterer, calculated from a Gaussian point spread function (red traces). The measured intensity plots correlate well with the theoretical intensities in both vertical (d) and horizontal (e) directions. Along with the retention of the LGNR spectral peak, this result suggests that the identified location likely contains a single LGNR. If more than one LGNR were present in the same area of one pixel, the spectrum would possibly change due to plasmonic hybridization and the pixel would not be detected as LGNR+.
Figure 2—figure supplement 9. Dark-field images of additional LGNR-injected H&E-stained sections.

Figure 2—figure supplement 9.

(a) kidney, (b) liver, (c) lung, (d) muscle, and (e) spleen.
Figure 2—figure supplement 10. Hyperspectral images of additional LGNR-injected H&E-stained sections.

Figure 2—figure supplement 10.

(a) kidney, (b) liver, (c) lung, (d) muscle, and (e) spleen.
Figure 2—figure supplement 11. HSM-AD detection of additional LGNR-injected H&E-stained sections.

Figure 2—figure supplement 11.

(a) kidney, (b) liver, (c) lung, (d) muscle, and (e) spleen. LGNR+ pixels are depicted in orange. Along with those in the main figures, these analyzed samples were used for calculations of detection sensitivity and specificity as well as whole-organ LGNR uptake.
Figure 2—figure supplement 12. Quantitative whole-organ biodistribution measured with HSM-AD on unstained tissue sections.

Figure 2—figure supplement 12.

All values are presented as the average relative LGNR signal (%) ± standard error of the mean (s.e.m) measured over four fields of view per organ. The results from unstained tissue sections are comparable to the results obtained for H&E stained sections.
Figure 2—figure supplement 13. Dark-field images of LGNR-injected unstained tissue sections.

Figure 2—figure supplement 13.

(a) kidney, (b) liver, (c) lung, (d) muscle, and (e) spleen.
Figure 2—figure supplement 14. HSM-AD detection of LGNR-injected unstained tissue sections.

Figure 2—figure supplement 14.

(a) kidney, (b) liver, (c) lung, (d) muscle, and (e) spleen. LGNR+ pixels are depicted in orange. These samples were used to calculate the values of LGNR uptake in unstained sections.
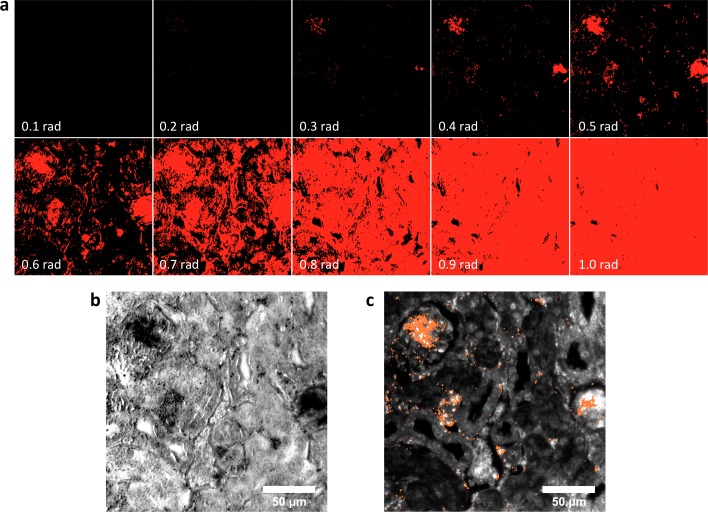
Figure 2—figure supplement 15. Spectral Angle Mapper (SAM) detection of LGNR+ kidney tissue.

Figure 2—figure supplement 15.

(a) Results of SAM classification of LGNR+ pixels (red masks) with various user-defined angular tolerance values (in radians, bottom-left of each panel). Selection of low angular tolerance results in poor detection sensitivity, while high tolerance leads to poor detection specificity. Along with other parameters, angular tolerance must be user-defined for each hyperspectral image. SAM classification was performed as described in reference 30. (b) Guide image corresponding to the SAM-classified masks in (a). (c) HSM-AD analysis of the same hyperspectral image. Diagnostic evaluation of this and related images yielded the sensitivity and specificity values reported in Figure 2—figure supplement 1. As noted in reference 21, such values are not readily extracted using SAM and related methods.