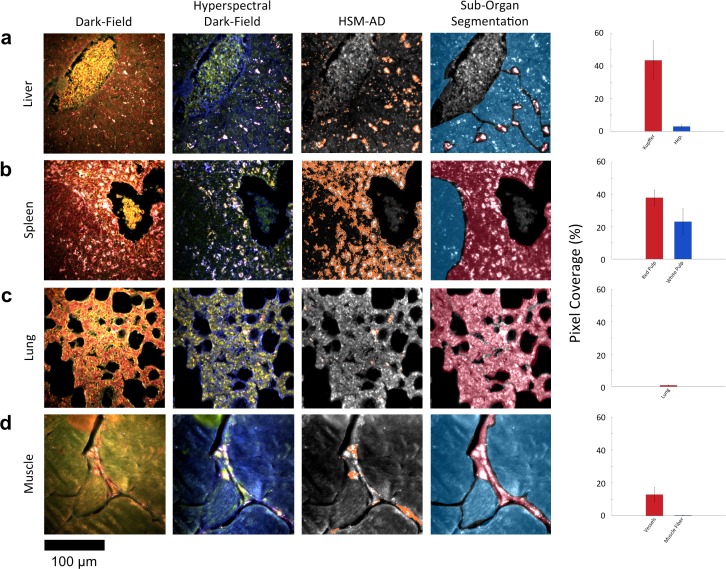
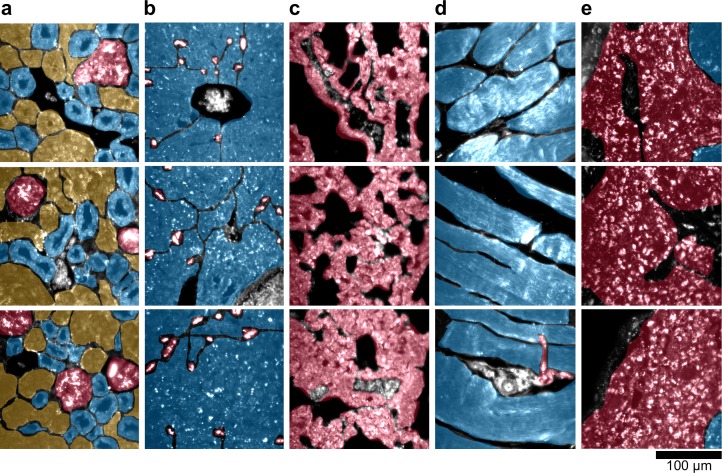
Figure 4. HSM-AD reveals characteristic patterns of nanoparticle microbiodistribution contingent upon tissue function.
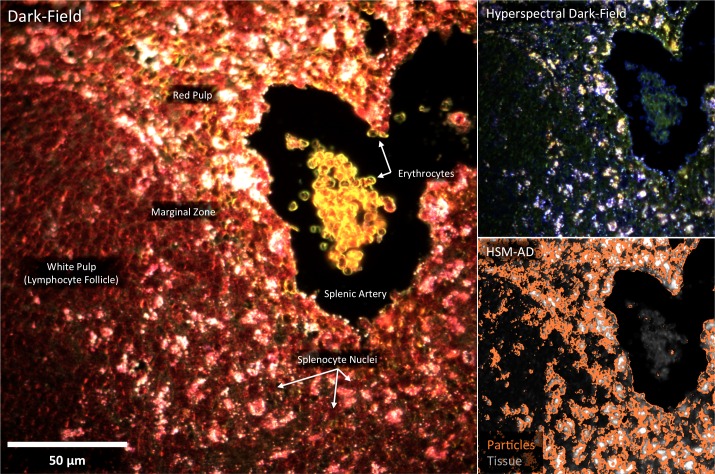
(a) LGNR accumulation in hepatic tissue occurs mostly in concentrated foci located within liver sinusoids. Along with the size, shape, and frequency of these foci, this pattern strongly suggests that these particles have been phagocytosed by Kupffer cells, the resident macrophages of the liver (red ROI). While there is mild uptake of LGNRs within liver hepatocytes (blue ROI), HSM-AD sub-organ quantification indicates that uptake by Kupffer cells is roughly 15-fold higher than hepatocytic accumulation. (b) The pattern of LGNR uptake in the spleen is also consistent with the physiological functions of various splenic tissues. A greater relative LGNR signal was observed in regions of splenic red pulp (red ROI), which is responsible for blood filtration, than in the white pulp follicles (blue ROI) that house B and T lymphocytes. (c,d) While LGNRs were prevalent within the liver and spleen tissues, HSM-AD results indicated minimal particle accumulation within the lung (c) or muscle (d) tissue samples (each < 1% relative LGNR signal for whole-tissue quantification). Interestingly, HSM-AD analysis demonstrated that the vast majority of LGNRs in muscle tissue sections were localized in blood vessels (red ROI) rather than within the muscle fiber tissue itself (blue ROI). Quantitative data are represented as mean ± s.e.m. as described previously.
DOI: http://dx.doi.org/10.7554/eLife.16352.028


