. 2016 Aug 18;5:e16352. doi: 10.7554/eLife.16352

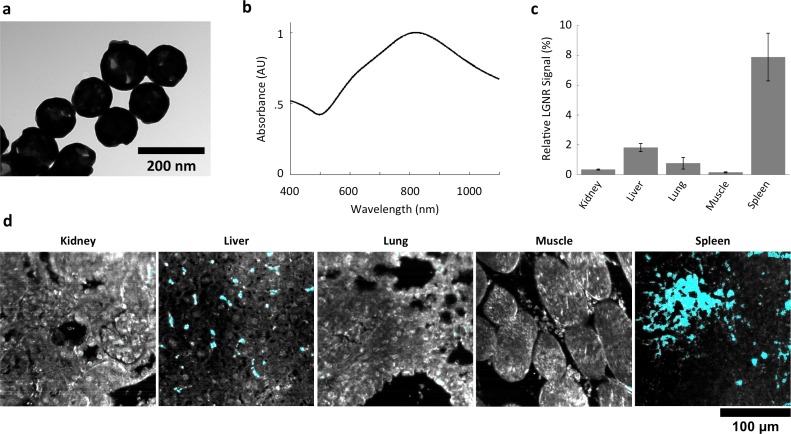
Figure 6. Characterization of gold nanoshell uptake after intravenous administration.

(a,b) Nanoshells (119 nm silica core with 14 nm-thick gold coating) exhibit distinct particle morphology and composition (a) that (like LGNRs) yield a near-infrared (~800 nm) spectral peak (b). However, the Nanoshell spectrum is markedly broader than the resonance observed for LGNRs. (c,d) HSM-AD revealed that Nanoshell uptake displays inter-organ distribution patterns somewhat similar to those observed for LGNRs, with maximal accumulation in the spleen (c). Values are represented as mean ± s.e.m. from four FOVs per tissue. However, there are notable distinctions including minimal Nanoshell uptake within kidney tissue and concentration of Nanoshells within splenic white pulp (d) (Nanoshell+ pixels are depicted in cyan).

DOI: http://dx.doi.org/10.7554/eLife.16352.033

Figure 6—source data 1. Data for Nanoshell uptake in organs.
DOI: 10.7554/eLife.16352.034

Figure 6.

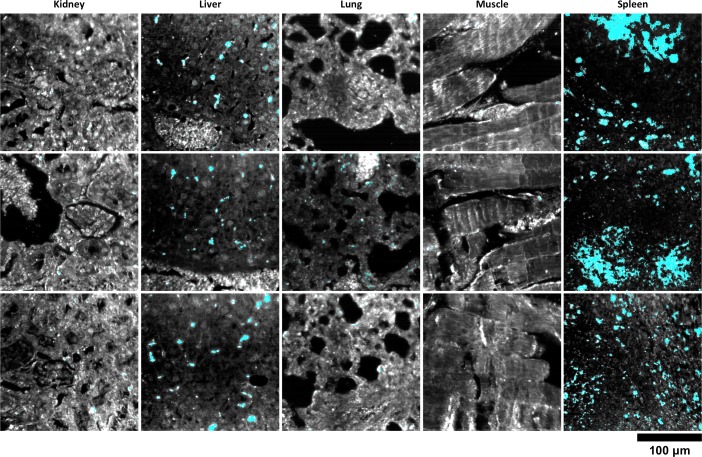
Figure 6—figure supplement 1. Additional HSM-AD images of Nanoshell uptake used for quantification.

Figure 6—figure supplement 1.

Quantitative data from these FOVs were used to produce the bar graph in Figure 6c.
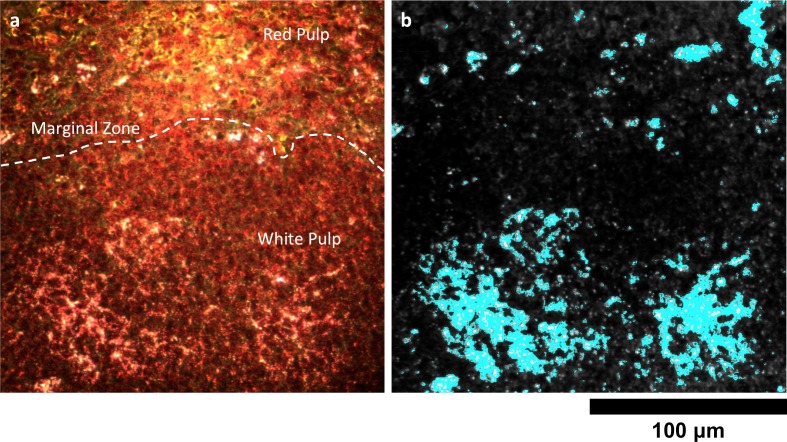
Figure 6—figure supplement 2. Detail of Nanoshell uptake in spleen tissue.

Figure 6—figure supplement 2.

(a) Conventional dark-field image of H&E-stained spleen tissue. The dashed white line approximately demarcates the marginal zone separating the red and white pulp. (b) HSM-AD indicates that, unlike LGNRs, Nanoshells are localized within white pulp follicles 24 hr after intravenous injection.
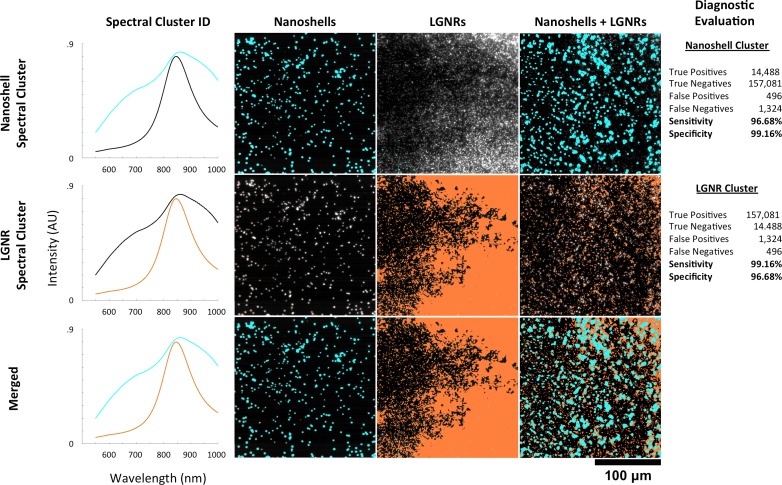
Figure 6—figure supplement 3. HSM-AD spectral unmixing of samples containing gold nanoshells and LGNRs.

Figure 6—figure supplement 3.

HSM-AD was trained on a hyperspectral image of a sample containing a mixture of Nanoshells and LGNRs. Using a target of two clusters, this training yielded one spectral cluster corresponding to the spectrum of the Nanoshells and another spectral cluster corresponding to LGNRs (far-left column). These clusters were then used to map images of Nanoshells + LGNRs, Nanoshells only, and LGNRs only. The presence of Nanoshells and LGNRs are marked using cyan and orange masks, respectively. HSM-AD classification using the Nanoshell cluster (top row) for all three sample types achieved 96.68% sensitivity and 99.16% specificity. HSM-AD classification using the LGNR cluster (middle row) for the samples achieved 99.16% specificity and 96.68% specificity. The bottom row depicts the merge of these two cluster maps. As a note, the reciprocal nature of the sensitivity and specificity values for the two different particle types results from the fact that, for pure particle solutions, the false positives for one particle type are false negatives for the other particle type and vice versa. The same reciprocal nature holds for true positives and true negatives as well. This relationship can be seen in the raw pixel counts used for diagnostic evaluation (far-right column).