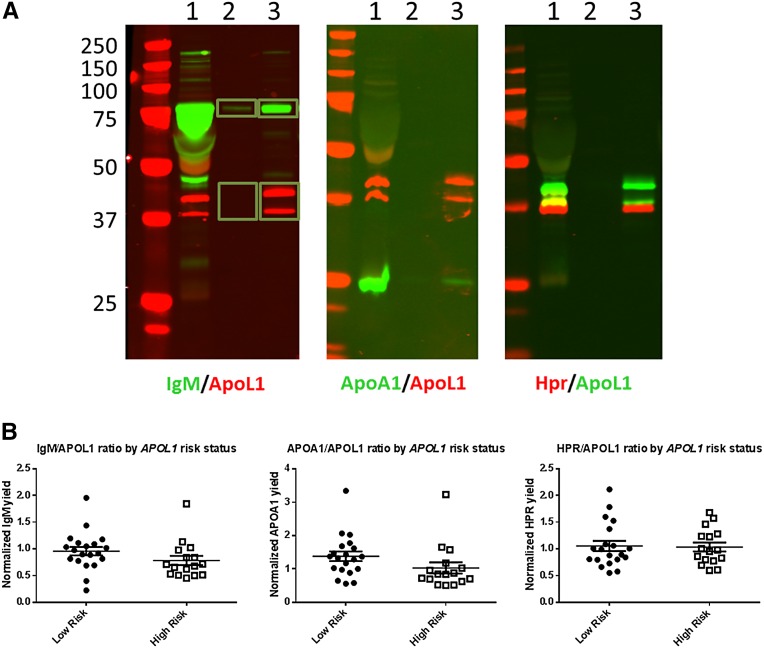
Figure 3.
Analysis of the protein complement of APOL1‑HDL in subjects with or without the RRG. (A) Representative images of semiquantitative immunoblotting to determine the relative amounts of APOL1‑HDL proteins within the particle. APOL1‑HDL was immunopurified from EDTA plasma under detergent-free conditions, and proteins were eluted with Laemmli buffer and separated via SDS‑PAGE. One percent of input (lane 1) and 10% of immunopurified material from control (lane 2) or APOL1 (lane 3) immunoprecipitations was loaded in each lane and blotted with antibodies specific for the proteins noted under each image. Shown is an overlay of signal from the 680 nm channel (rabbit antibodies) and the 800 nm channel (mouse antibodies). Yellow indicates areas of overlap in the overlay. Signal was quantified separately for regions of interest for each channel. The yield of APOA1, HPR, and IgM were determined relative to the input amount and normalized for the yield of APOL1 calculated for each image. (B) APOL1‑HDL was purified from EDTA plasma using from 20 subjects without and 16 subjects without the RRG and the relative levels of known APOL1‑HDL associated proteins were determined by semiquantitative immunoblotting, as detailed above. Differences between low- and high-risk genotypes were tested by t test. No statistically significant changes (P<0.05) in the APOL1 normalized levels of IgM, APOA1, or HPR were noted.

