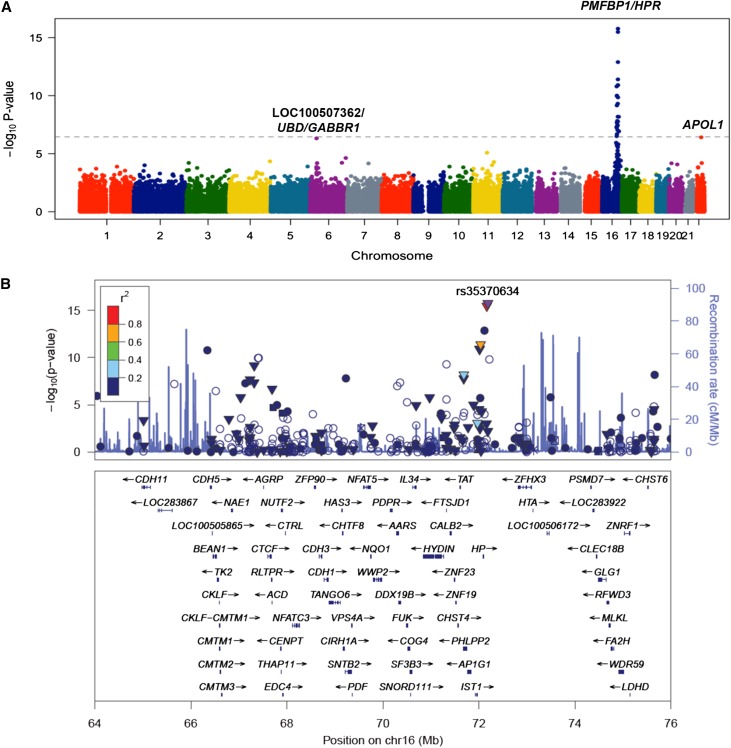
Figure 4.
Exome-wide association analysis for circulating APOL1 levels in DHS. (A) A Manhattan plot showing highly significant genome-wide association between the HPR locus on chromosome 16 and APOL1 levels. Each dot represents a SNP plotted against its chromosomal position on the x-axis and the strength of the association (–log10 P-value) on the vertical axis. The dashed line denotes the Bonferroni-corrected exome-wide significance threshold. (B) Regional plot of association with plasma total APOL1 levels at the HPR locus. Each dot represents a SNP plotted against its chromosomal position (using hg19 coordinates). The vertical axis shows –log10 P-values from single-SNP analysis for association with APOL1 levels. The most significant SNP at the locus is shown in purple color. The remaining SNPs are color-coded according to their linkage disequilibrium with the lead SNP as indicated by the color key. The strength of linkage disequilibrium is measured by pairwise R2 values based on the DHS data. Estimated recombination rates (from HapMap) are shown by the blue line, with spikes indicating locations of frequent recombination. Genes located in the region and the direction of transcription are noted below the plots based on the data from UCSC genome browser (www.genome.ucsc.edu). (▼) Nonsynonymous variants, (▪) coding variants, and (•) SNPs with no functional annotation and (○ ) noncoding variants. The plot was generated using LocusZoom software.46

