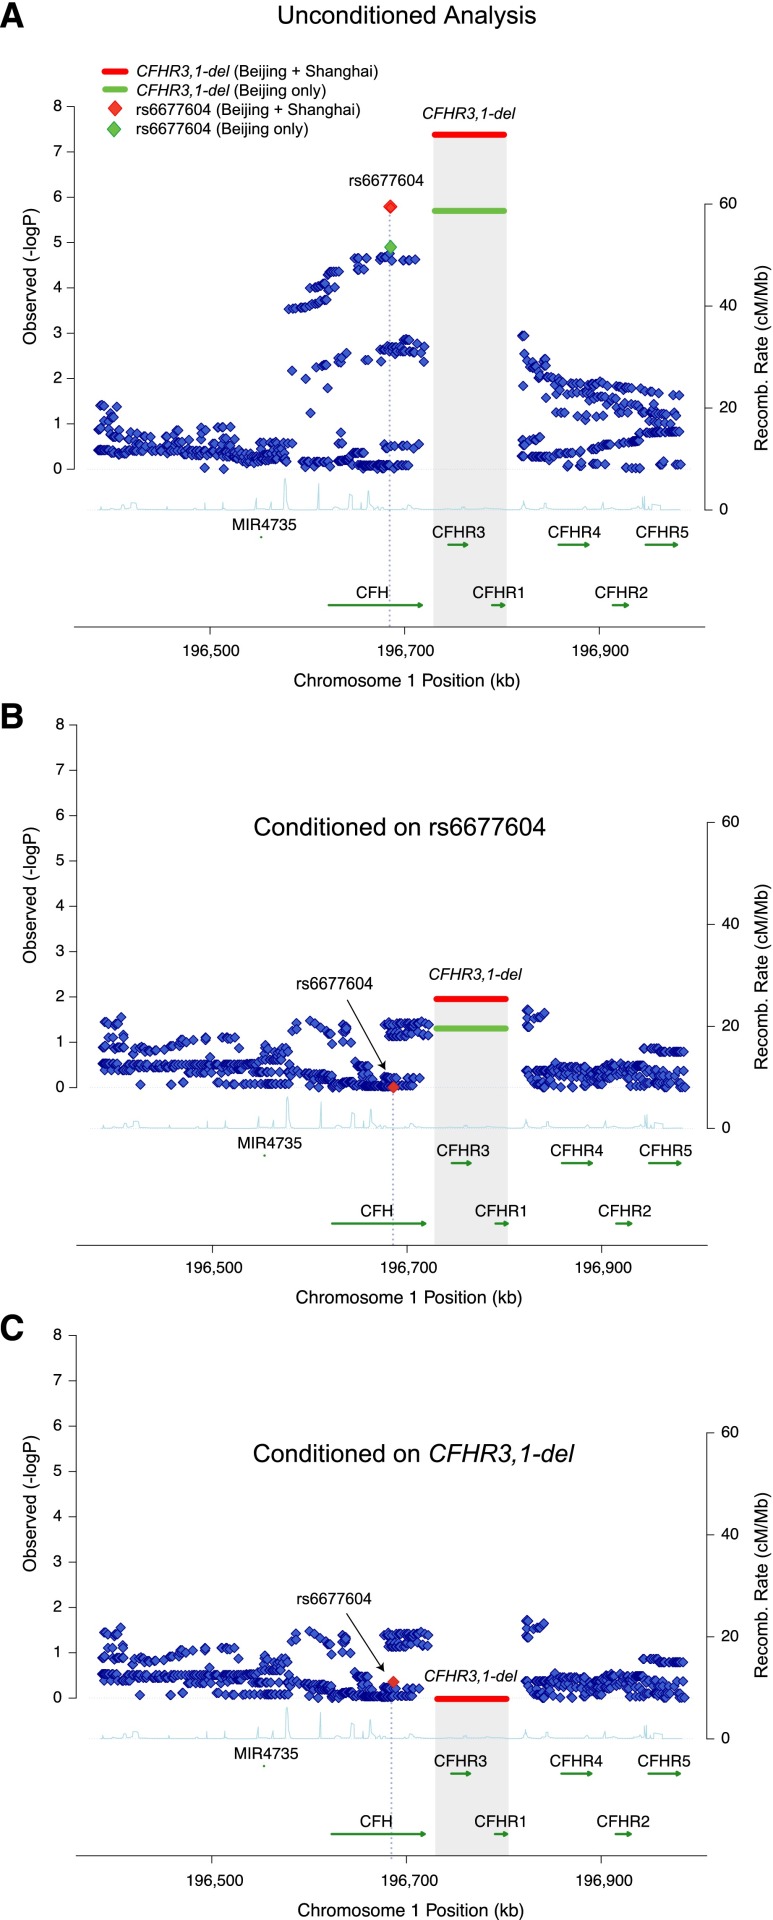
Figure 1.
High–resolution regional plots for the CFH locus, including a complete set of the 1000 Genomes Project phase 3 imputed markers. (A) First–pass association analysis: CFHR3,1Δ polymorphism represents the top association in the region. (B) Conditional association results after adjusting for rs6677604 genotypes: the association of CFHR3,1Δ persists after accounting for the effect of rs6677604. (C) The reciprocal conditioning on CFHR3,1Δ completely abrogates any association of rs6677604. The y axis corresponds to the level of statistical significance (−log–transformed P values for the test of association); the shaded area represents the deletion of CFHR3 and CFHR1 genes, with the horizontal bar indicating the level of statistical significance for the MLPA-typed deletion. Green symbols represent the association results for the Beijing cohort (1185 patients and 882 controls); red symbols correspond to combined results for the Beijing and Shanghai cohorts (1907 patients and 1632 controls).

