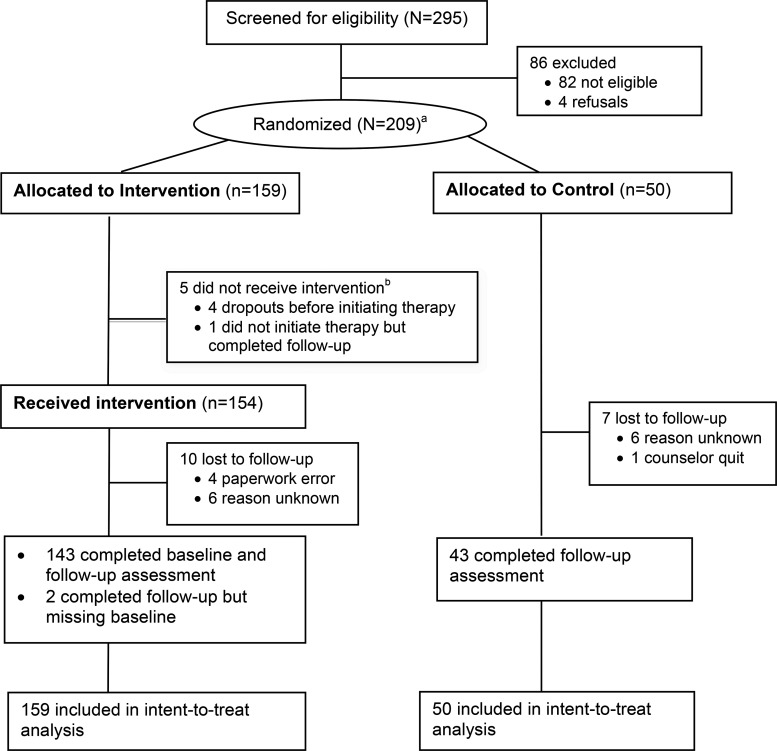
FIGURE.
Flow Chart of Study Participants
a295 individuals were screened at baseline and 209 randomized. However, data at baseline were missing for 2 individuals randomized to the intervention and followed‐up; thus, we had data for only 293 people screened and 207 randomized.
b Of the 5 people allocated to the study intervention who did not receive it, 3 opted for financial support, 1 was assigned to a counselor who quit, and the last person’s reasons were unknown.

