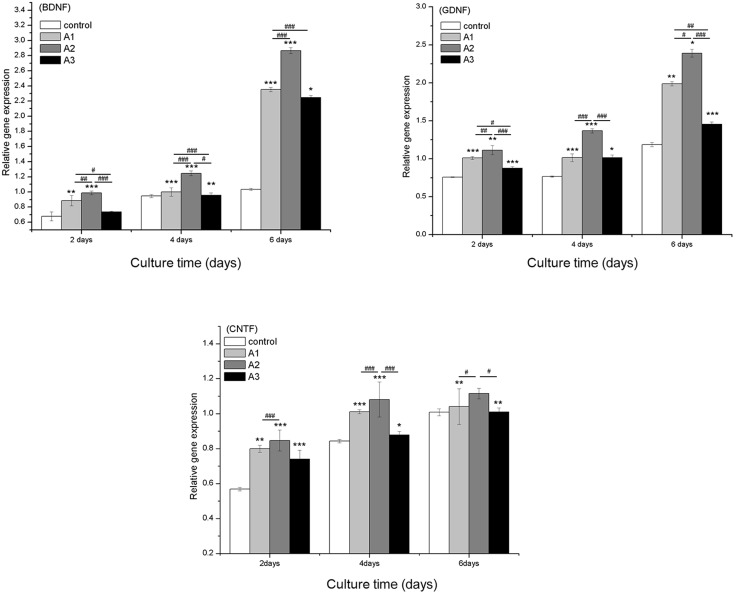
Figure 7.
Quantitative comparison of neurotrophic-related gene expression by reverse transcription-quantitative polymerase chain reaction. The RSC96 Schwann cells were cultured with 0 µM (control), 1.5625 µM (A1), 3.125 µM (A2) and 6.25 µM (A3) andrographolide (Andro) for 2, 4 and 6 days. The gene expression levels in Andro-treated cells were compared with the control group using the 2−ΔΔCq method. Glyceraldehyde 3-phosphate dehydrogenase was used as an internal control. Data are presented as the mean ± standard deviation of five independent experiments. *P<0.05, **P<0.01,***P<0.001 vs. control; #P<0.05, ##P<0.01, ###P<0.001 vs. A1, A2 and A3. BDNF, brain-derived neurotrophic factor; GDNF, glial cell-derived neuroptrophic factor; CTNF, ciliary neurotrophic factor.

