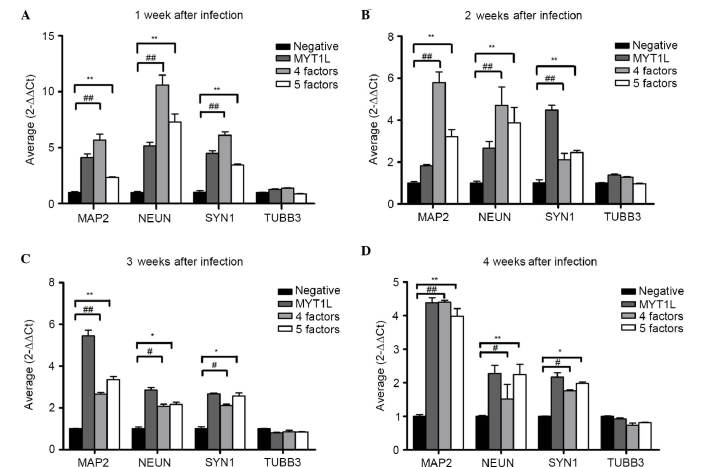
Figure 5.
Results of reverse transcription-quantitative polymerase chain reaction analysis of A375 irNCs. Statistical analyses of the expression levels of neuron-specific markers in the empty-virus, four-factor and five-factor groups at week (A) 1, (B) 2, (C) 3 and (D) 4. The levels of MAP2, NEUN and SYN1 from the four-factor and five-factor group were higher, compared with the negative control in the 4 weeks. Data are expressed as the mean ± standard deviation. ##**P<0.01 and #*P<0.05. irNCs, induced resembled neuronal cells; MAP2, microtubule-associated protein 2; NEUN, neuronal nuclei; SYN1, synapsin 1.

