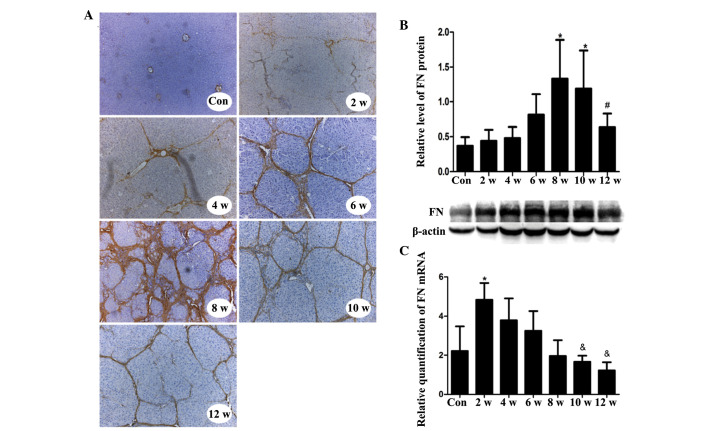
Figure 4.
In vivo FN mRNA and protein expression in CCl4-treated and control rats, and the location of FN in liver tissue during the course of hepatic fibrogenesis. (A) FN staining in liver sections from control and CCl4-treated rats. One representative image from each time point is shown. Original magnification, ×200. (B) Protein expression levels of FN in the liver, as detected by western blotting. (C) mRNA expression levels of FN relative to glyceraldehyde 3-phosphate dehydrogenase, as detected by quantitative polymerase chain reaction. Each sample was analyzed in duplicate (n=6/group). Data are presented as the mean ± standard deviation. *P<0.05 vs. the Con group; #P<0.05 vs. the 8 w group; &P<0.05 vs. the 2 w group. Con, control; CCl4, carbon tetrachloride; FN, fibronectin.

