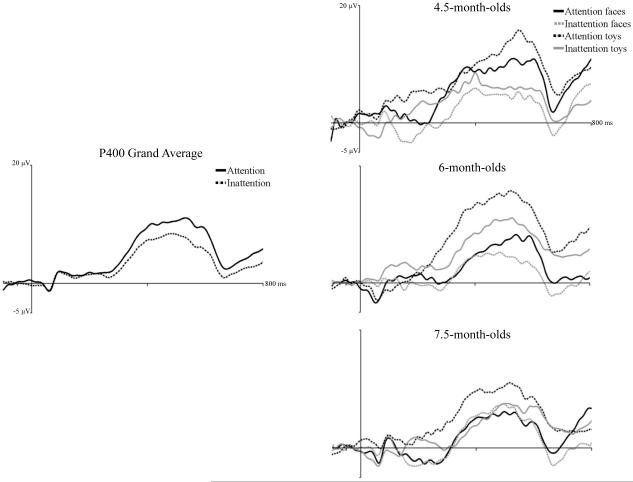
Figure 4.
The effect of attention on P400 responses to faces and toys. The panels show the ERP response from 50 ms preceding stimulus onset through 800 ms following stimulus onset averaged over medial posterior-inferior scalp areas (PO7-10, O1-2, I1-2, Oz, and Iz). The left panel shows the response averaged over all ages, separately for HR-defined periods of attention and inattention. The right panels show the responses separately for responses during attention to faces, attention to toys, inattention to faces, and inattention to toys, done separately for the three testing ages.

