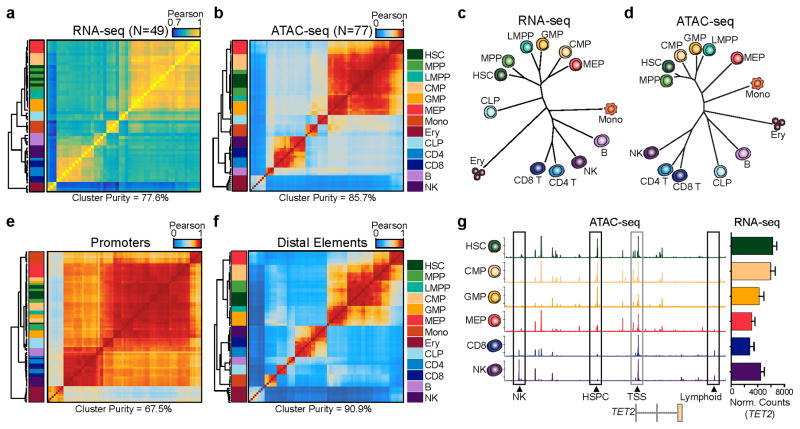
Figure 2. Distal regulatory elements enable accurate classification of the hematopoietic hierarchy.
(a,b) Unsupervised hierarchical clustering of (a) RNA-seq (N=49) and (b) ATAC-seq (N=77) data from all replicates of 13 normal hematopoietic cell types. Values shown are Pearson correlation coefficients. Cluster purity quantifies the degree that cells of the same lineage (color coded in the key) are clustered together. For RNA-seq, clustering was performed using variance stabilizing transform-normalized expression data for all expressed annotated genes. For ATAC-seq, clustering was performed on all peaks using quantile normalized quantitative read coverage data.
(c,d) Phylogenetic dendrograms of (c) RNA-seq and (d) ATAC-seq data showing inter-cell type correlations derived from aggregate averages of all biological and technical replicates. Length of tree branches represents Euclidean distance. Data represents the union of all technical and biological replicates for each cell type.
(e,f) Hierarchical clustering of ATAC-seq profiles (N=77) mapping to (e) promoters and (f) distal regulatory elements. Values shown are Pearson correlation coefficients. Promoter-proximal peaks are defined as +/−1 kilobase from an annotated TSS. Distal element peaks are defined as those peaks greater than 1 kilobase from an annotated TSS.
(g) ATAC-seq peaks in the TET2 locus show highly variable distal regulatory landscapes (left) and relatively constitutive expression of TET2 (right). Data represents the union of all technical and biological replicates for each cell type: HSC=7; CMP=8; GMP=7; MEP=7; CD8=5; NK=6. Error bars represent 1 standard deviation. Genomic coordinates: chr4:106031731–106073198. Y axis scale ranges from 0–10 in normalized arbitrary units.

