Figure 1.
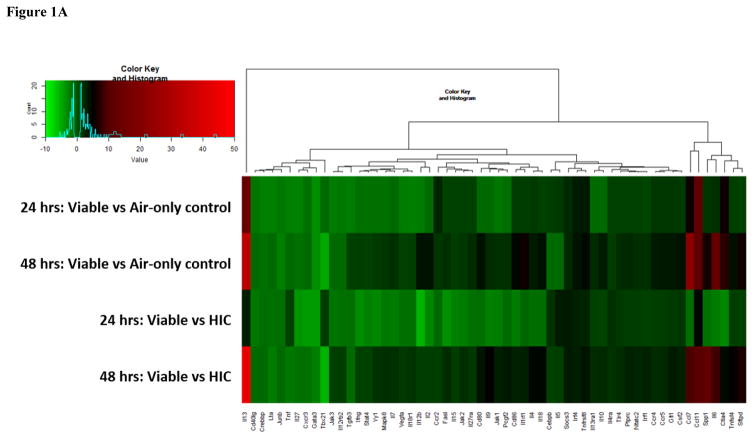
Figure 1A: Heat map of genes involved in the Th1 and Th2 immune response pathways. Genes are color-coded (red or green for up- and downregulation, respectively).
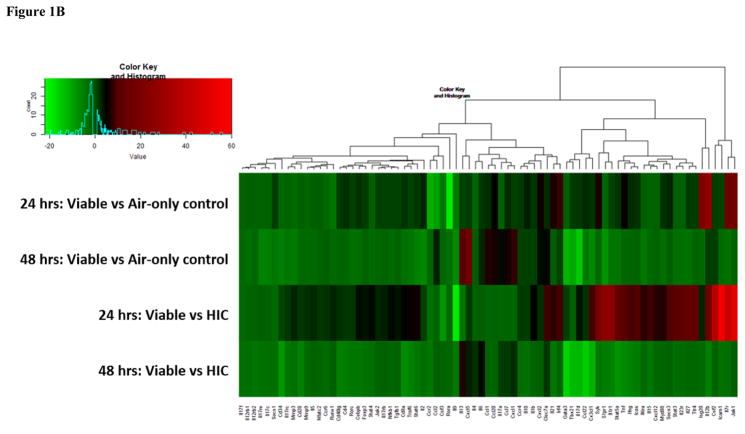
Figure 1B: Heat map of genes involved in the Th17 immune response pathways. Genes are color-coded (red or green for up- and downregulation, respectively).
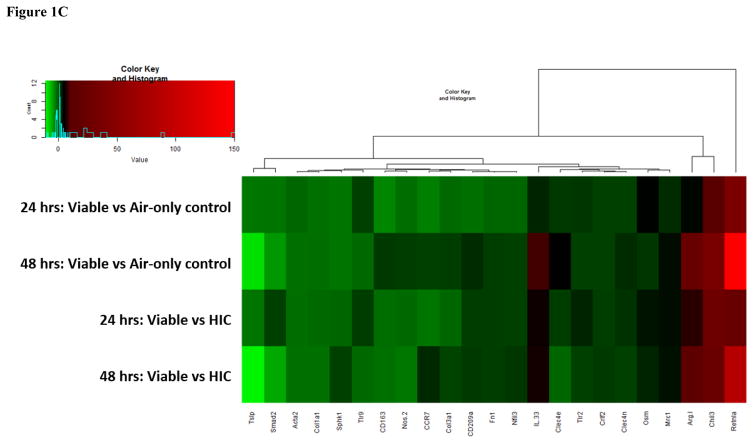
Figure 1C: Heat map of additional genes involved in the immune response. Genes are color-coded (red or green for up- and downregulation, respectively).


