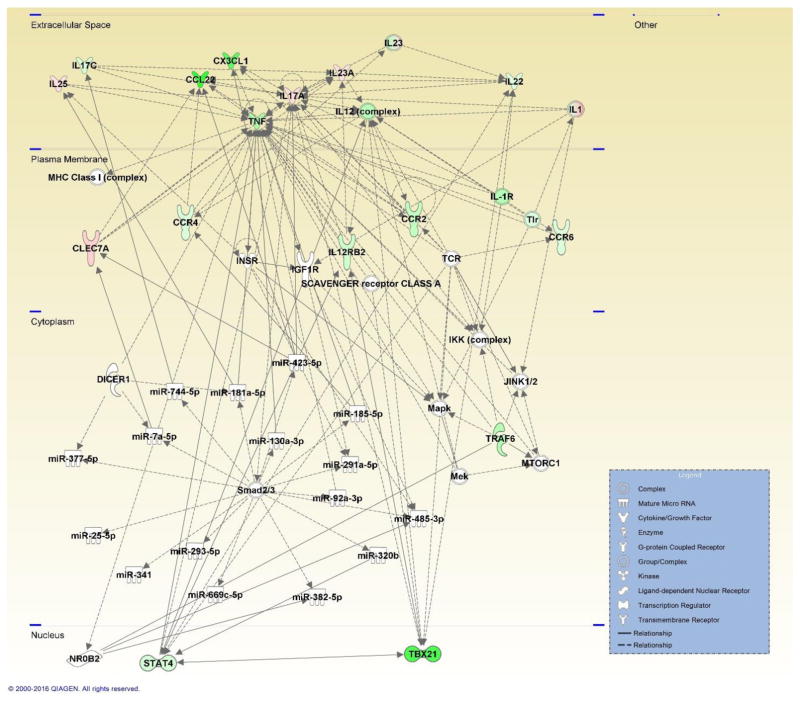
Figure 3. Network map generated by IPA depicting genes involved in the Th17 immune response and associated miRNA involved in the inflammatory response, shaped by gene function and positioned by subcellular location.
Genes are color-coded (red or green for up- and downregulation, respectively) for the expression of Th17 genes in the viable versus HIC group 48 hours post-exposure.

