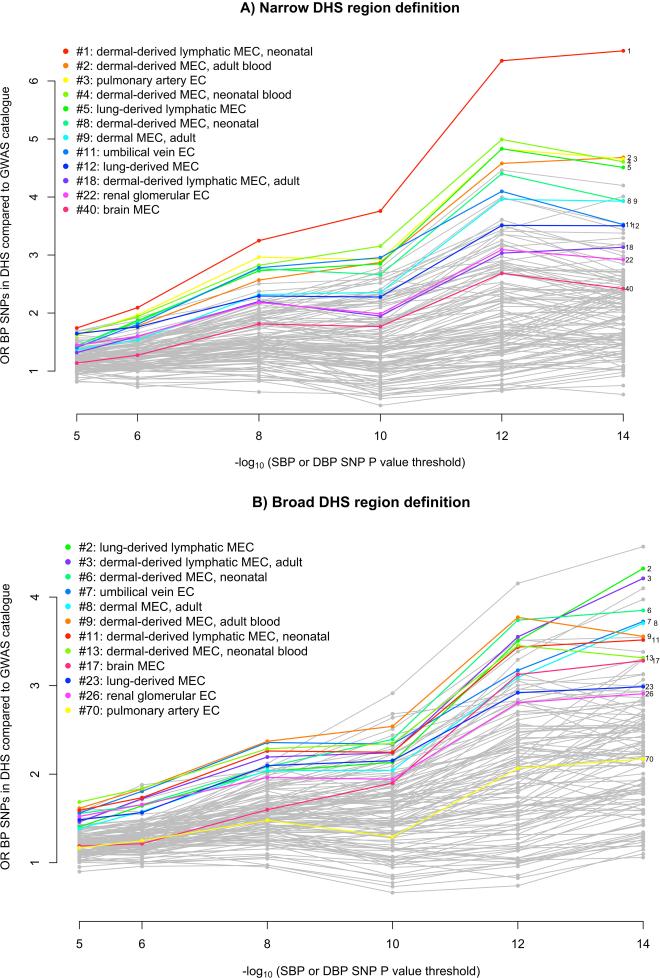
Figure 2. Enrichment of DNAse hypersensitive sites among BP loci in different cell-types.
Enrichment analyses of SBP or DBP associated loci according to discovery P value using narrow peaks (panel A) or broad peaks (panel B). SNPs were selected according to different P value cutoffs (x-axis) and a fold enrichment of overlap with DNAse hypersensitive sites compared to unrelated GWAS SNPs was calculated (y-axis) (see Supplementary Note). The 12 endothelial cell-lines are indicated in color and for each endothelial cell-type the rank using the 10−14 P value cutoff is indicated. EC denotes endothelial cells.

