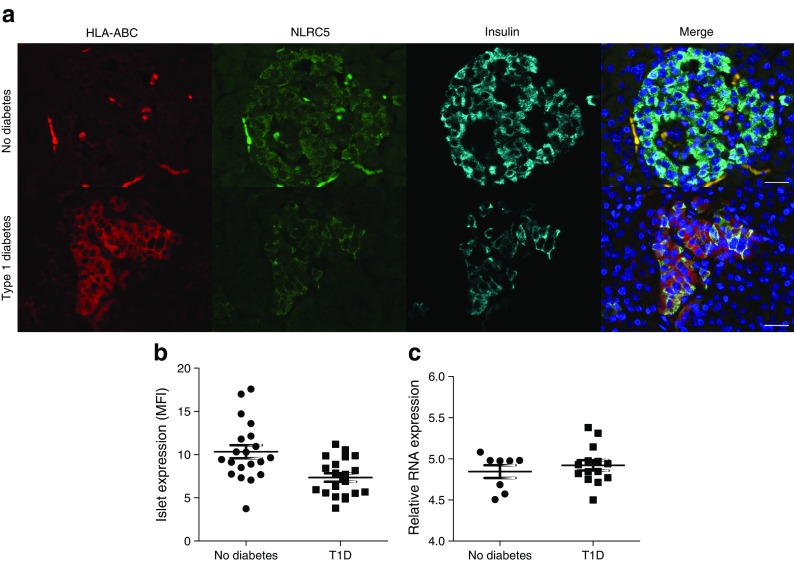
Fig. 5.
Expression of NLRC5 in the islets of control individuals and those with type 1 diabetes. (a) Representative islets from an individual without diabetes and a patient with type 1 diabetes are shown (red, HLA-ABC; green, NLRC5; light blue, insulin; dark blue, DAPI). Scale bar, 25 μm. (b) MFI values for NLRC5 protein expression were quantified after immunostaining in five islets per section from four control and four type 1 diabetes (three from the UK, one from nPOD) samples (p = 0.0704). (c) Expression of NLRC5 was compared in RNA isolated from islets of individuals with and without type 1 diabetes (p = 0.4504)

