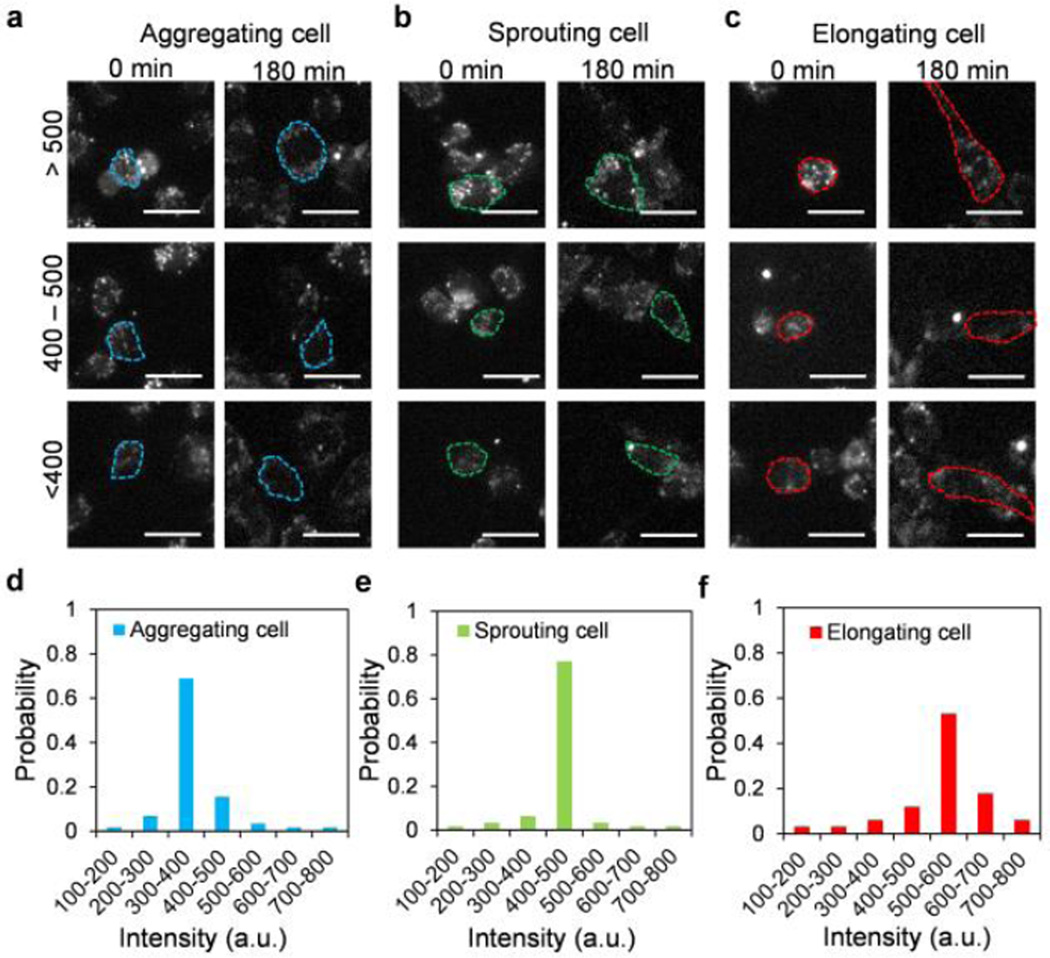
Fig. 4.
Dll4 mRNA expression distributions in cell subpopulations. (a–c) Dll4 mRNA expressions of aggregating cell, sprouting cell and elongating cell. Scale bars, 20 µm. (d–f) Distributions of Dll4 mRNA expression in aggregating cells, sprouting cells and elongating cells. Data represent over 100 cells in each group.

