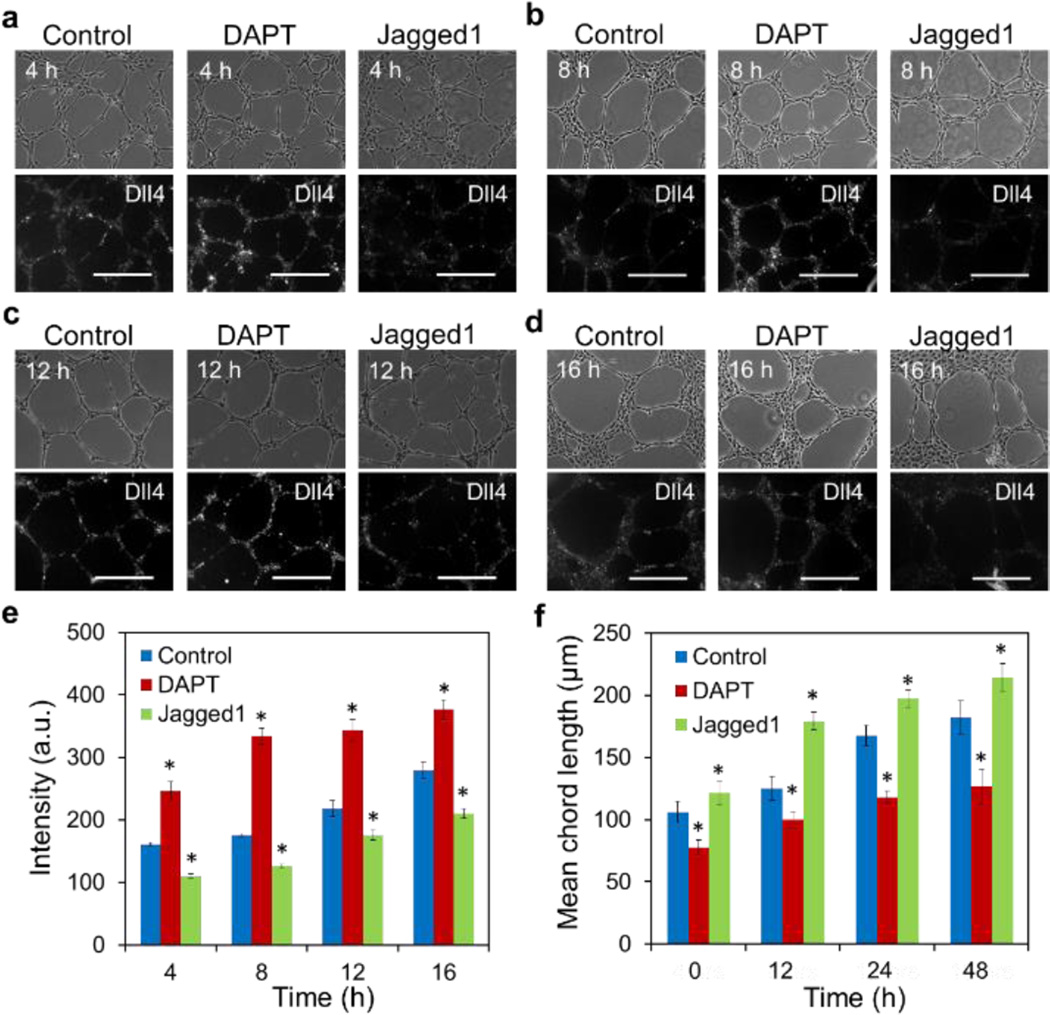
Fig. 5.
Notch signaling modulates Dll4 mRNA expression and microvascular network architecture. (a–d) Bright-field and fluorescence images of microvascular networks in control, DAPT, and Jagged1 at 4 hours, 8 hours, 12 hours and 16 hours, respectively. Scale bars, 200 µm. (e) Mean fluorescence intensity of Dll4 mRNA expression in microvascular networks. Data represent over 100 cells in each group and are expressed as mean ± s.e.m. (n=5, * P<0.001). (f) Mean chord lengths of microvascular networks at different time points. Data are expressed as mean ± s.e.m. (n=5, * P<0.001)

