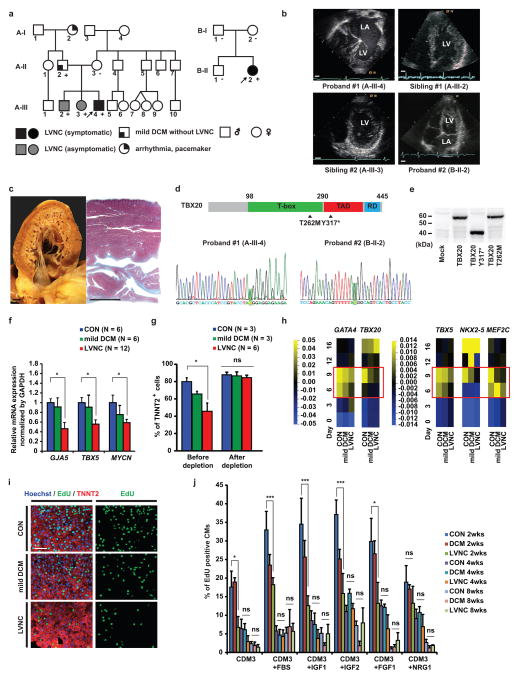
Figure 1. Characterization of patient-specific LVNC iPSC-CMs carrying TBX20 mutation.
a, Schematic pedigree of two families with LVNC. The probands are indicated by arrow (A-III-4 and B-II-2). “+” and “−” signs indicate presence and absence of the TBX20 Y317* mutation in the family A and T262M mutation in the family B, respectively. b, LVNC phenotype of the proband #1 (A-III-4), two siblings (A-III-2 and A-III-3), and an isolated proband #2 (B-II-2) are assessed by echocardiography. LA, left atrium; LV, left ventricle. Scale bars, 1 cm. c, The proband #1’s explanted heart (left) and Masson’s trichrome staining of the left ventricle (right). Scale bars, 1 cm. d, Schema of TBX20 and position of Y317* and T262M mutations (Upper). Confirmation of the Y317* (c. 951C>A) and T262M (c. 785C>T) mutation on the TBX20 gene (highlighted in green) (Lower). TAD, transactivation domain; RD repression domain. e, Western blot of FLAG tagged wild-type, Y317* and T262M TBX20 mutant protein overexpressed in HEK293 cells. f, Significant downregulation of TBX20 downstream target gene mRNA expression in LVNC iPSC-CMs. g, The efficiency of cardiac differentiation of patient-specific iPSC lines validated by FACS sorting. h, Heat map showed mRNA expression of cardiac transcription factors in iPSCs from day 0 to day 16 after induction of cardiac differentiation. The LVNC iPSCs showed significant decrease of cardiac transcription factors in day 6 and day 9 (red boxes). n=6 independent experiments. Mean=0. i, Immunostaining of nuclear (blue), TNNT2 (red), and EdU (green) in iPSC-CMs at 2 weeks. Scale bars, 100 μm. j, Percentage of EdU+ cardiomyocytes in control, mild DCM, and LVNC iPSC-CMs with or without serum (n=10, 10 and 30 for CON, mild DCM and LVNC independent experiments respectively at 2 weeks; n=4 independent experiments per each group at 4 and 8 weeks) or with growth factors (n=4 independent experiments per each group at 2, 4, and 8 weeks). CON, unrelated controls. *p < 0.05, ***p < 0.005; ns, not significant in one-way ANOVA followed by Tukey post hoc test. The bar graphs show the mean and error bars represent s.e.m. Statistics source data can be found in Supplementary Table 12. Unprocessed original scans of blots are shown in Supplementary Fig. 8.

