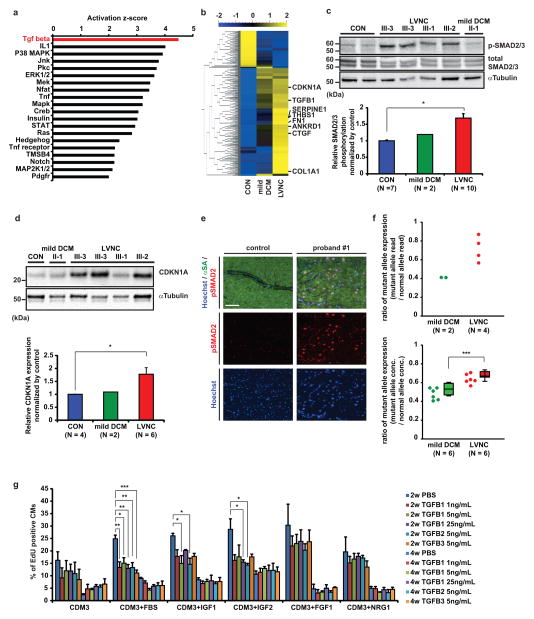
Figure 2. Upregulation of TGFβ signaling in LVNC phenotype.
a, Upstream regulator analysis of signaling pathway comparing LVNC and control iPSC-CMs at 2 weeks after induction of cardiac differentiation. The p-value measures whether there is a statistically significant overlap between the dataset genes and the genes that are regulated by a transcription regulator. b, Heat map showing upregulation of TGFβ signaling pathway in LVNC (III-2, 3, 4; mean of four samples) and mild DCM (II-2; mean of two samples) compared to control iPSC-CMs (unrelated controls; mean of two samples). Mean=0, variance=1. c, Western blot of total and phospho-SMAD2/3 in control and patient-specific iPSC-CMs (upper) and densitometry analysis, normalized against α-tubulin (lower). d, Western blot of CDKN1A protein in control and patient-specific iPSC-CMs (upper) and densitometry analysis, normalized against α-tubulin (lower). e, Immunostaining of nuclear (blue), alpha-sarcomeric actin (green), and phospho-SMAD2 (red) in LV of control donor heart tissue vs. explanted heart of proband #1. f, Allele-specific mRNA expression analysis by mRNA-sequencing (upper panel) and digital droplet PCR (lower panel) showed a higher ratio of TBX20 mutant allele expression in LVNC iPSC-CMs compared to mild DCM iPSC-CMs. n=6 independent experiments. g, The effect of TGFβ isoform treatments on the percentage of EdU+ cardiomyocytes in control iPSC-CMs with or without growth factors. PBS treated control; n = 4 independent experiments, TGFβ treated samples; n = 3 independent experiments. CON, unrelated controls. *p < 0.05, **p < 0.01, ***p < 0.005 in unpaired two-tailed t-test or one-way ANOVA followed by Tukey post hoc test. The bar graphs show the mean and error bars represent s.e.m. Scale bars, 100 μm. Statistics source data can be found in Supplementary Table 12. Unprocessed original scans of blots are shown in Supplementary Fig. 8.

