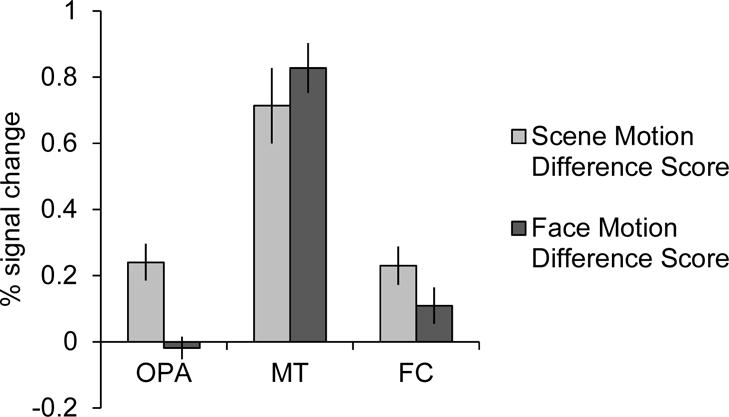
Figure 3.

Difference scores (percent signal change) for Dynamic Scenes minus Static Scenes (“Scene Motion Difference Score”) and Dynamic Faces minus Static Faces (“Face Motion Difference Score”) in OPA, MT (a motion-selective region), and FC (a low-level visual region). OPA responded significantly more to scene motion than face motion, relative to both MT (F(1,7) = 95.41, p < 0.001) and FC (F(1,14) = 9.96, p < 0.01), indicating that the response to scene-selective motion in OPA does not reflect differences in the amount of motion information in the scene stimuli compared to the face stimuli, or information inherited from low-level visual regions.
