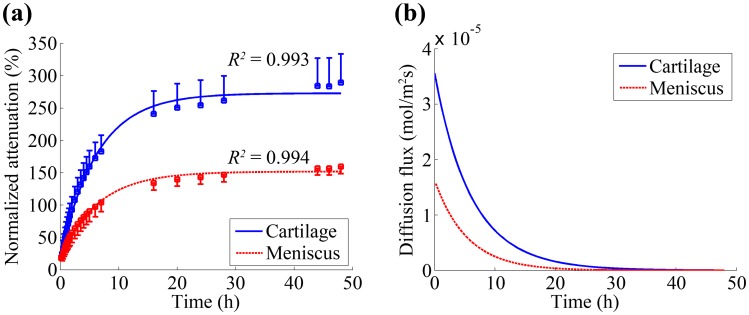
Figure 3.
(a) Mean (n = 10) normalized attenuation in bovine cartilage (+SD) and meniscus (-SD) at 26 different time points (10, 20, 30, 40, 50, 60, 70, 80 90 and 100 min, and 2, 2.5, 3, 3.5, 4, 4.5, 5, 6, 7, 16, 20, 24, 28, 44, 46 and 48 h after immersion). The normalized attenuation was significantly higher (p < 0.05) in cartilage than in meniscus at all time points after 50 min. (b) Mean (n = 10) diffusion fluxes for cartilage and meniscus as a function of immersion time. The diffusion flux was significantly higher (p < 0.05) in cartilage than in meniscus at all time points.

