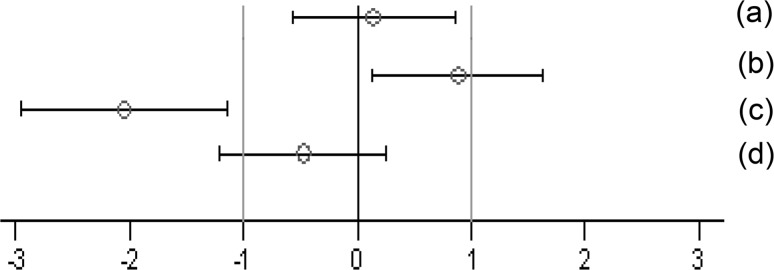
Fig. 1.
Simplified version of a graph allowing visual assessment of statistical significance as well as the supposed biological and possible toxicological relevance of group comparisons. The standard effect size point estimate (circle) and the 95 % confidence limits (whiskers, bars show confidence interval) illustrate the (standardized) effect size between two groups. The vertical black line indicates no effect (zero difference), while the vertical grey lines indicate the supposed biological and possible toxicological relevance limits (here ±1.0 SD, according to the study design). If the confidence interval bars cross the zero line but not the grey lines (lie within the ±1.0 limits), there is evidence for no statistical significance as well as no biological relevance (case a). Two groups are significantly different when the confidence interval bars do not cross the black vertical line (cases b, c). The effect size between two groups is supposed to be potentially relevant, when the confidence interval bars lie outside the ±1.0 SD limits (case c). Case b indicates statistical significance, but no clear biological relevance. Case d indicates no statistical significance, but no clear negation of biological relevance. This figure is Fig. 1 of the study by Zeljenková et al. (2014)

