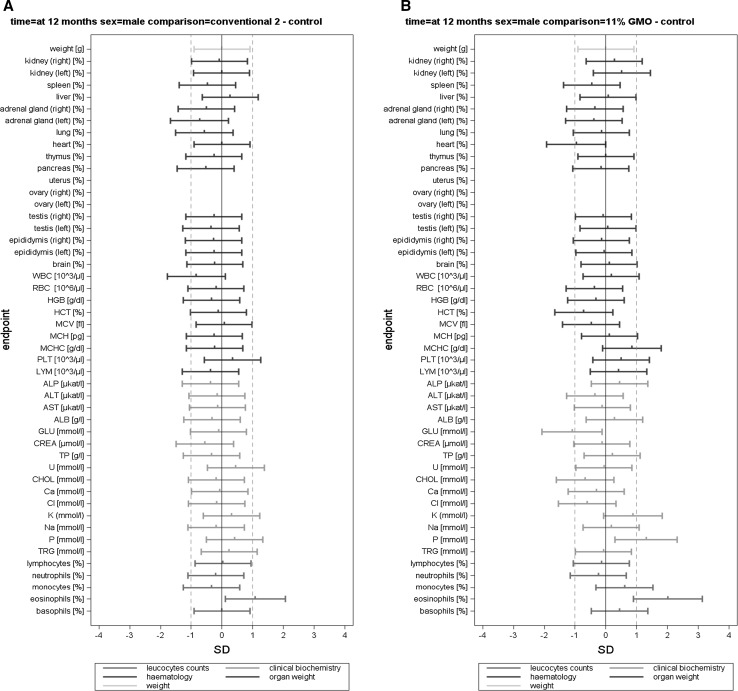
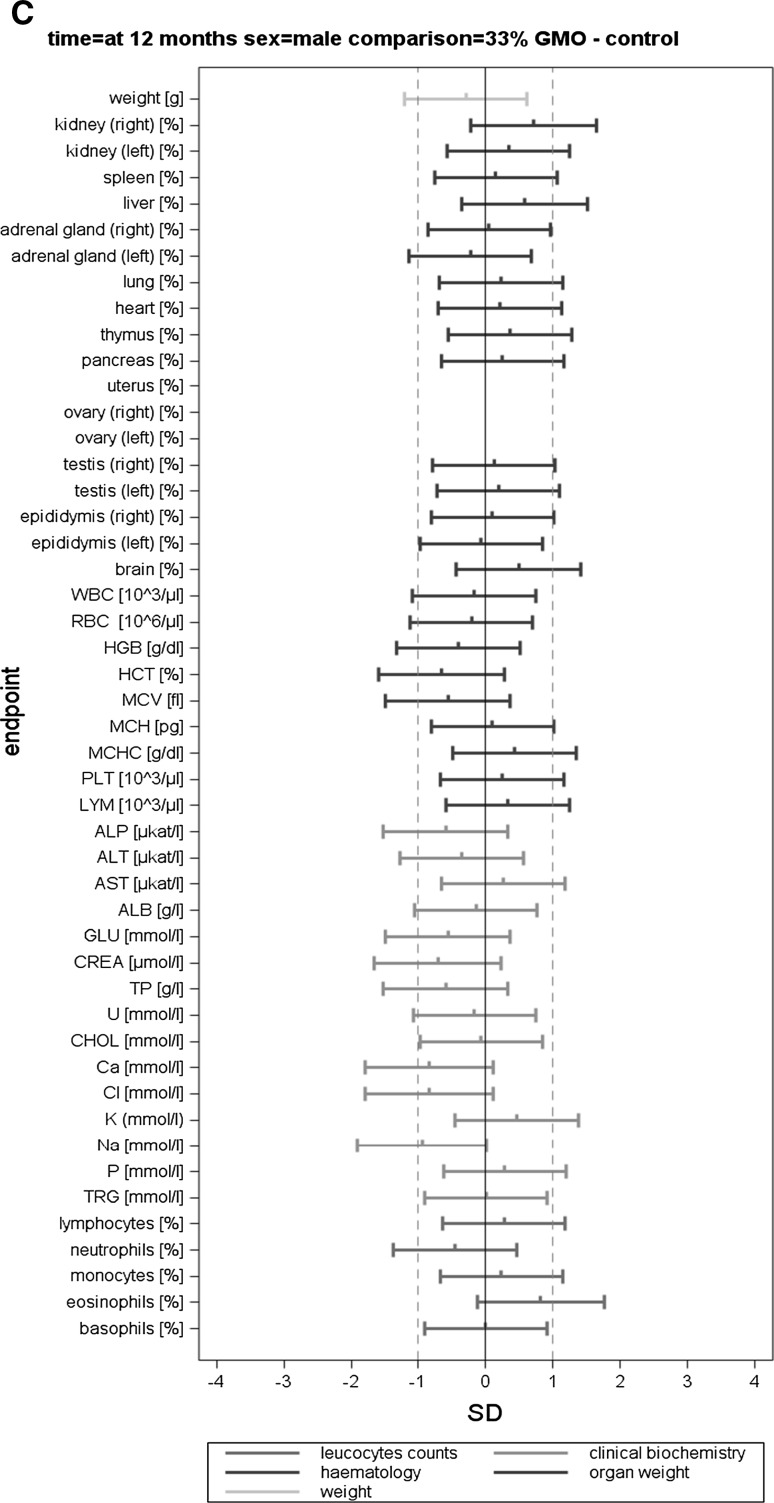
Fig. 5.
Standardized effect size graphs for the comparison of the body weight, relative organ weight, haematology, clinical biochemistry and differential leucocyte count data between the control and the conventional 2 (A), 11 % GMO (B) and 33 % GMO (C) groups in the case of male rats in the 1-year feeding trial


