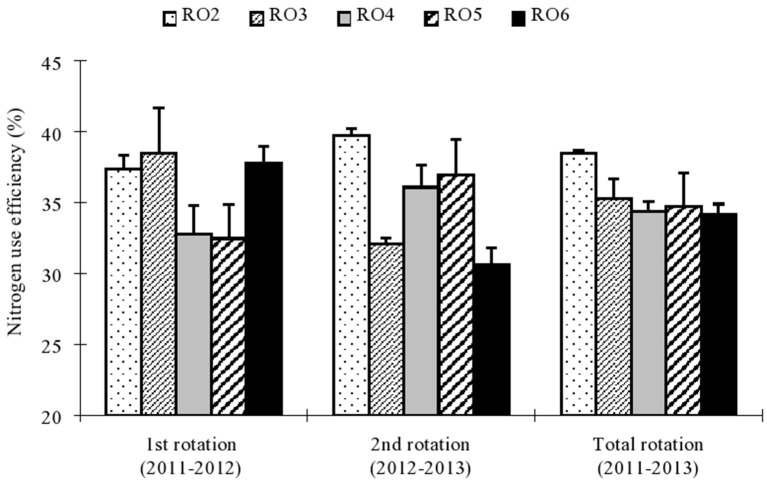
Figure 2.
Nitrogen (N) use efficiency (NUE %) of rice and oilseed rape as affected by different N application rates in the 1st (2011–2012), 2nd (2012–2013), and total rotation (2011–2013). Each value represents the standard error (n = 3). Within a season, bars with different letters are significantly different at P < 0.05 according to LSD.

