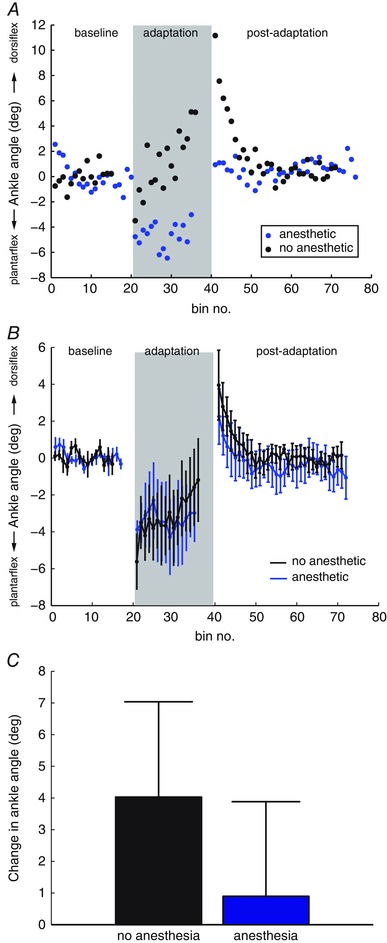
Figure 2. Effects of foot anaesthesia on ankle adaptation .

A, stride‐by‐stride ankle adaptation with no anaesthesia (black) is compared to adaptation with foot anaesthesia (blue) in an example subject (S10). Each point represents the mean ankle angle over three strides. B, group average (n = 5) peak ankle dorsiflexion during baseline, adaptation and post‐adaptation periods without anaesthetic (black) and with foot anaesthetic (blue). Error bars represent one SD. C, group average (n = 5) adaptation without anaesthetic (black) and with foot anaesthetic (blue), measured as the difference in ankle deviation in the first three trials in the adaptation period (A1) and the last three trials of the adaptation period (A2). Error bars represent one SD. [Colour figure can be viewed at wileyonlinelibrary.com]
