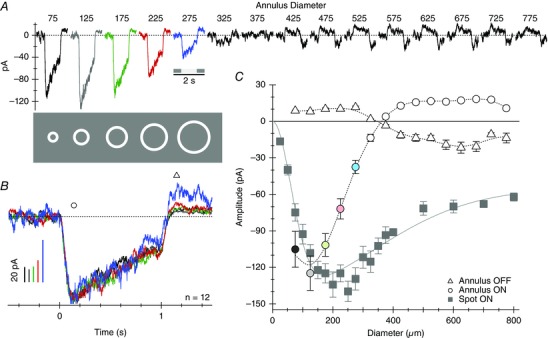
Figure 4. EPSCs recorded at the chloride reversal potential in response to annuli of increasing size .

A, average responses from 12 cells. The relative sizes of the first five stimuli are illustrated below the traces. The width of the annuli were fixed at 50 μm, and the mean diameter was increased in 50 μm increments from 75 μm (ID = 50 μm, OD = 100 μm) up to 325 μm. Contrast was held constant at 80%. B, the first five responses from A are superimposed and amplitudes normalized to compare the time course of the EPSCs. C, EPSC amplitude as a function of annulus diameter. Open circles and triangles were measured at the time points indicated by the corresponding symbols in B. The symbol colours correspond to the traces in A. The grey squares show the average peak responses for a series of spots of increasing diameter in the same 12 cells. The continuous line shows the best fitting difference‐of‐Gaussians function. The width (2σ) of the centre and surround Gaussians were 172 ± 23 and 930 ± 215 μm, respectively.
