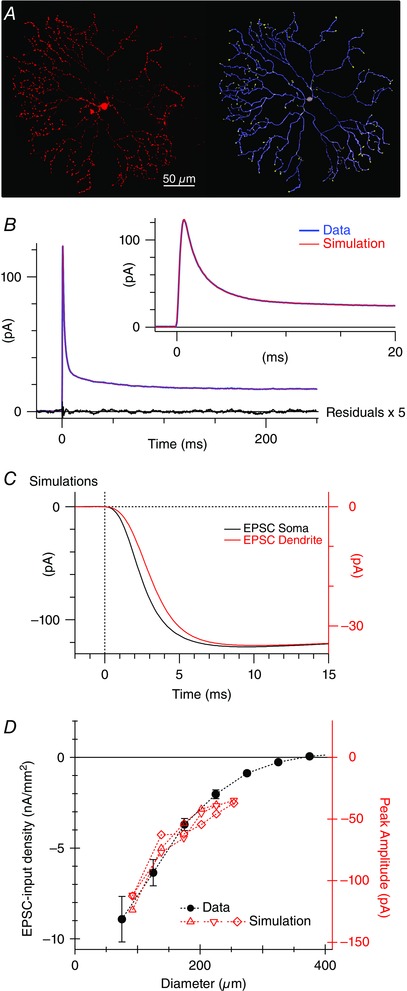
Figure 5. Simulations demonstrating that the EPSC time course is not limited by dendritic filtering .

A, a confocal micrograph of an SBAC fluorescently labelled with Alexa dye (left) and the corresponding digitized morphology used for simulations (right). B, current responses to a 5 mV voltage step. Two hundred positive and inverted negative responses were averaged (blue). The biophysical parameters in the compartmental model were adjusted to obtain the best fit (red overlay, see Methods). The black line shows the residuals after subtracting the fit from the data. The residuals are shown at a 5‐fold higher gain and indicate that there was no systematic deviation between the model prediction and the data. C, current traces produced by excitatory conductance applied to the soma (black) or the peripheral dendrites (red). Note the 3‐fold difference in the vertical scaling required to normalize the amplitudes. The current recorded at the soma was attenuated due to electrotonic decay in the dendrites, but the time course was only slightly delayed and slowed. Similar results were obtained in two other cells. D, filled symbols show the peak amplitude of the EPSCs (open circles in Fig. 4 C) normalized for stimulus area. The red symbols show the amplitude of simulated EPSCs in the three reconstructed cells produced by conductances applied at various distances from the soma (black). There is good agreement with the real data (red).
