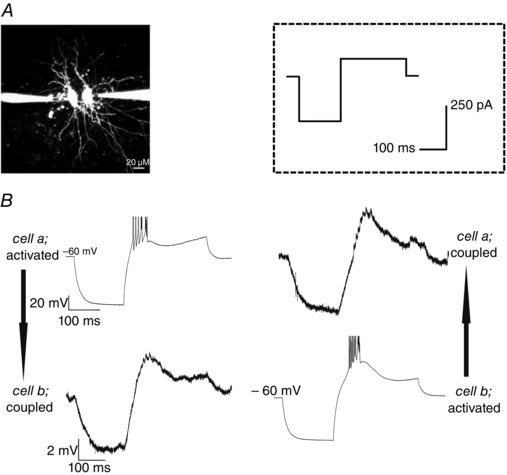
Figure 1. Recording of coupled RTN neurons .

A, photomicrograph showing two simultaneously recorded RTN neurons, each filled via a patch pipette with fluorescent dye Alexa 594. Scale bar = 20 μm. B, example recording traces of coupled RTN neurons. Injection of a hyperpolarizing (−250 pA, 150 ms duration) followed by a depolarizing (100 pA, 250 ms) current step (from −60 mV; stimulation protocol shown in inset) produced a membrane hyperpolarization and rebound LTS in the activated neuron, and a concurrent hyperpolarization and burstlet in the coupled neuron. Electrical coupling was thus strong enough to produce a rebound LTS in the coupled cell. Spikes in traces are truncated for clarity.
