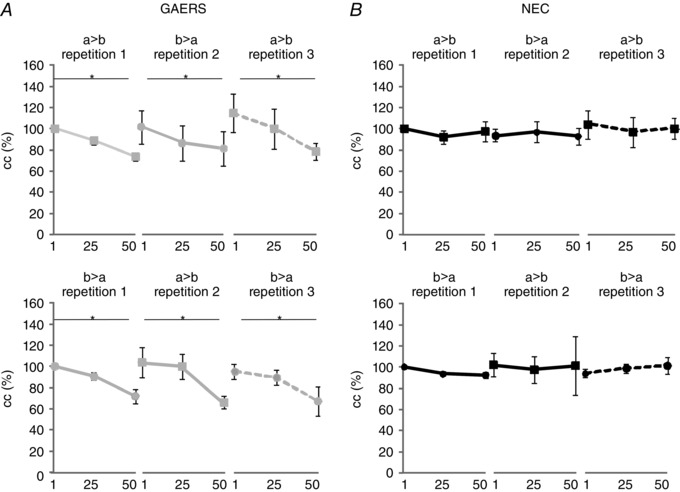
Figure 3. Gap junctional coupling of RTN neurons during repeated activation .

Neurons were repeatedly activated by injection of series of stimuli (50 alternating hyperpolarizing and depolarizing current steps; step protocol as in Fig. 1 B), starting with direct current injection in one cell (cell a) (repetition 1), followed by injection in the other cell (cell b) (repetition 2) in a given pair, and finally in cell a again (repetition 3) (a → b, b → a, a → b). The series of stimuli was repeated in this order in a given pair (a → b, b → a, a → b), and 10 min later in reversed order (b → a, a → b, b → a). Average cc values taken at three different time points of stimulation (1, 25, 50; see text) are illustrated for NEC (black, B) and GAERS (grey, A). Directionality and order of stimulation are indicated as a → b, b → a, a → b and b → a, a → b, b → a, where the cell in front of the arrow denotes the activated cell and the cell behind the arrow denotes the coupled cell in a given pair of RTN neurons. Note the gradual decline of cc in GAERS (n = 6 cell pairs, six rats) which is absent in NEC (n = 6 cell pairs, six rats). Asterisks indicate significant changes (*, P < 0.01).
