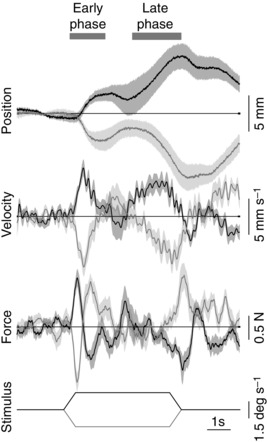
Figure 1. Example group mean responses .

Mean responses (n = 10) (±SEM indicated by shaded areas) to one visual scene velocity profile (plateau speed 1.5 deg s–1) presented in clockwise (black traces) or anticlockwise (grey traces) directions. Traces from bottom: visual scene velocity profile, mediolateral ground reaction shear force on the body, mediolateral velocity and position of the body at the level of C7. Positive deflection denotes clockwise for stimulus traces and rightwards for position, velocity and force traces. Note the symmetrical behaviour in the two directions and the two response phases marked by horizontal bars at top.
