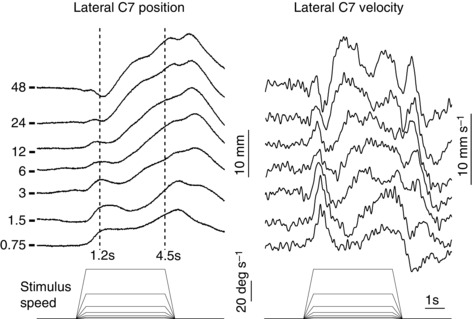
Figure 2. Effect of visual scene motion profile on kinematic responses .

Group mean (n = 10) mediolateral displacement (left) and velocity (right) of the body at the level of C7 to different visual scene velocity profiles shown at bottom. Responses to clockwise and anticlockwise stimuli have been combined and averaged. Positive deflection indicates towards the direction of the stimulus. The plateau velocity magnitudes associated with each response are indicated on the left of position traces. Short horizontal lines on the left show the baseline level for each position trace. Vertical dashed lines indicate the measurement times.
