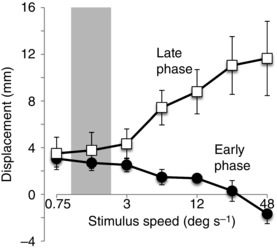
Figure 3. Effect of visual scene plateau velocity magnitude on body displacement .

Group mean (±SEM) mediolateral displacement at the level of C7 shown separately for the early‐phase (filled circles) and late‐phase (open squares) responses plotted against visual scene plateau velocity on a logarithmic scale. The shaded area denotes the mean ± 1.96 × SD of upper‐limit spontaneous sway velocities for the group recorded during static trials.
