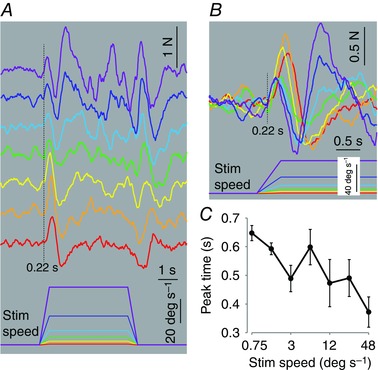
Figure 4. Effect of visual scene profile on force response .

A, group mean (n = 10) mediolateral ground reaction force after averaging responses from clockwise and anticlockwise stimuli. Positive deflection indicates towards the direction of the stimulus. Visual scene velocity profile (bottom) and the associated responses are colour coded for identification. Order of traces same as for Fig. 2. B, same data as A but with time scale expanded and traces superimposed with same colour coding. C, group mean (±SEM) time of initial peak force response plotted against visual scene plateau velocity on a logarithmic scale.
