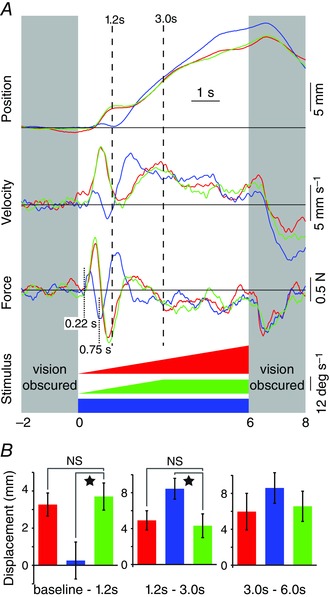
Figure 5. Effect of visual scene velocity profiles used in experiment 2 on kinematic and kinetic responses .

A, group mean (n = 11) mediolateral responses colour coded according to visual scene velocity profiles (bottom). From top, mediolateral body displacement and velocity at the level of C7 and ground reaction force. Responses averaged for clockwise and anticlockwise stimuli. Positive deflection indicates towards the direction of the stimulus. Grey areas denote periods when subjects were deprived of vision using liquid crystal goggles. Vertical dashed lines indicate measurement times. B, group mean (±SEM) C7 displacement measured over the three intervals of baseline to 1.2 s, 1.2–3.0 s and 3.0–6.0 s (panels left to right, respectively). Bars colour coded according to the stimulus profile shown in A. When ANOVA indicated a significant effect of stimulus profile on displacement magnitude the data were investigated using analysis of contrasts with the ramp and hold profile (green bar) as the reference condition. Star indicates a significant difference (P < 0.05). NS, not significant.
