
Figure 4. CaV2.2 cell surface expression: effects of β1b and α2δ‐1 .
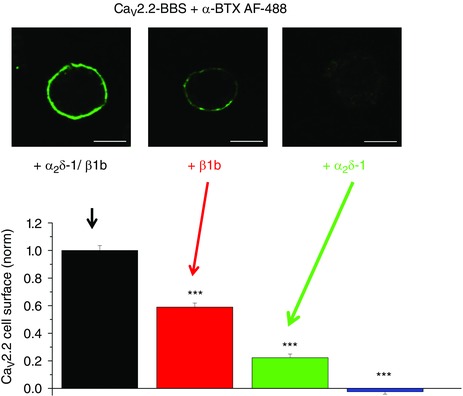
Cell surface expression of bungarotoxin binding site (BBS) tagged CaV2.2 labelled with α‐bungarotoxin (BTX) coupled to AF488 dye (green). Top panel: examples of N2a cells transfected with CaV2.2–β1b–α2δ‐1 (left), CaV2.2–β1b (middle) and CaV2.2–α2δ‐1 (right). Scale bar 20 μm. Bottom panel: mean (± SEM) data for cell surface expression of CaV2.2, for cells expressing CaV2.2–β1b–α2δ‐1 (black bar), CaV2.2–β1b (red bar) and CaV2.2–α2δ‐1 (green bar) or CaV2.2 alone (blue bar). Data are taken from a recent study (Cassidy et al. 2014).