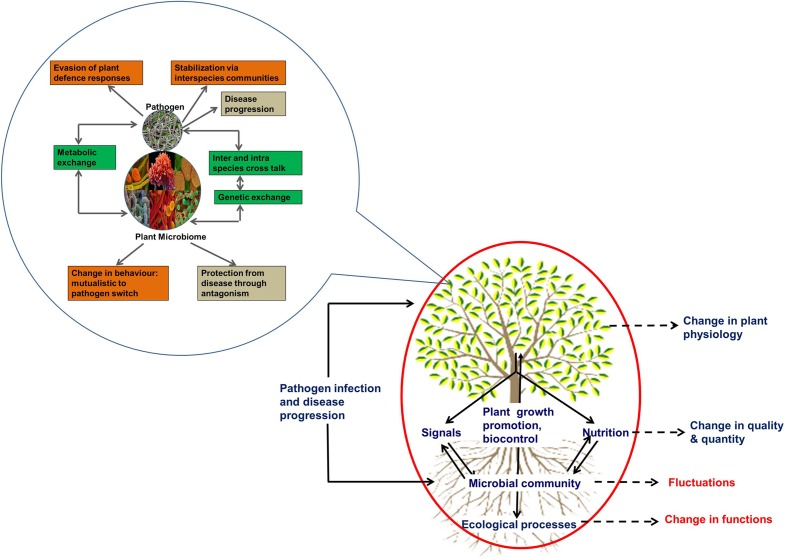
FIGURE 2.
Conceptual framework of the effect of plant disease. The processes mediated by plant associated microbial communities are enclosed in the red circle. Black dotted arrows represent changes in various processes in response to pathogen infection and disease progression. Those shown in red color are poorly understood. The inset enclosed in blue circle shows the possible mechanisms involved in the interaction between incoming pathogens and resident microbes. The interactions are shown in green boxes. The changes in phenotypes are shown in orange boxes and the effects on the host are shown in black boxes.

