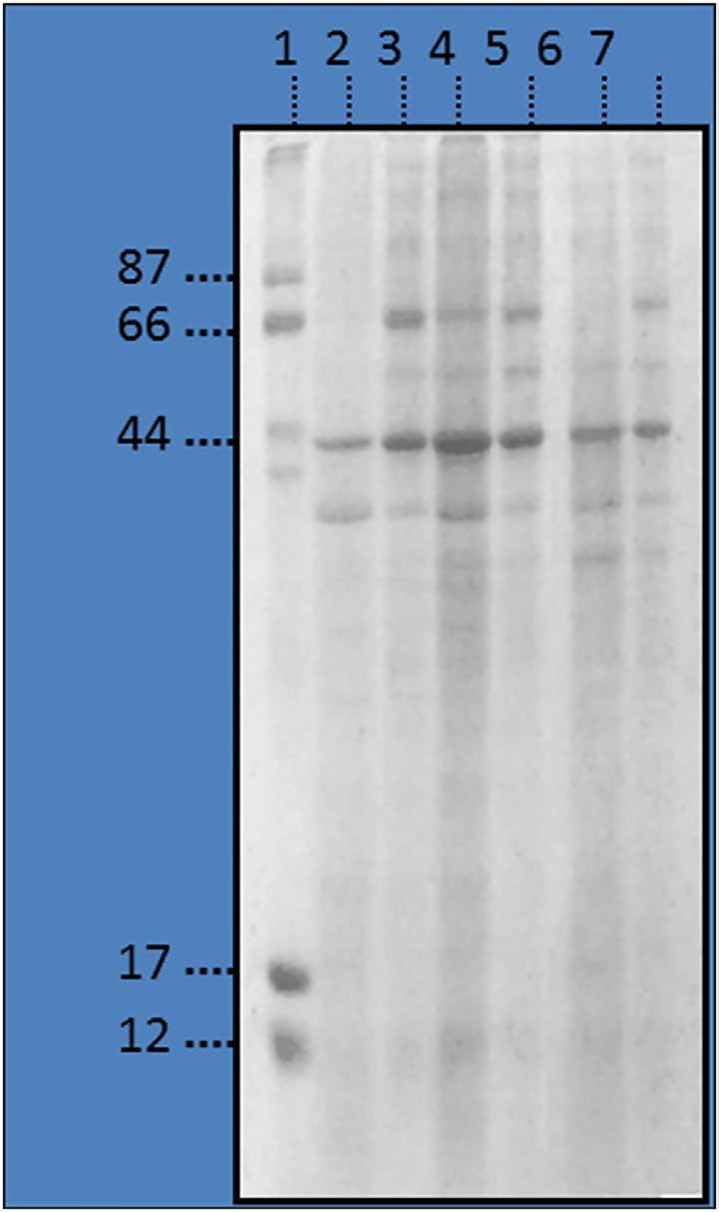
Figure 1. Electrophoresis profile of prostate human tissue.
Lanes: 1. Marker. 2-3: Depleted and whole fractions from human tumoral (T) prostate tissue from patient A. 4-5: Depleted and whole fractions from human tumoral (T) prostate tissue from patient B. 6-7: Depleted and whole fractions from human non tumoral (NT) prostate tissue from patient B.

