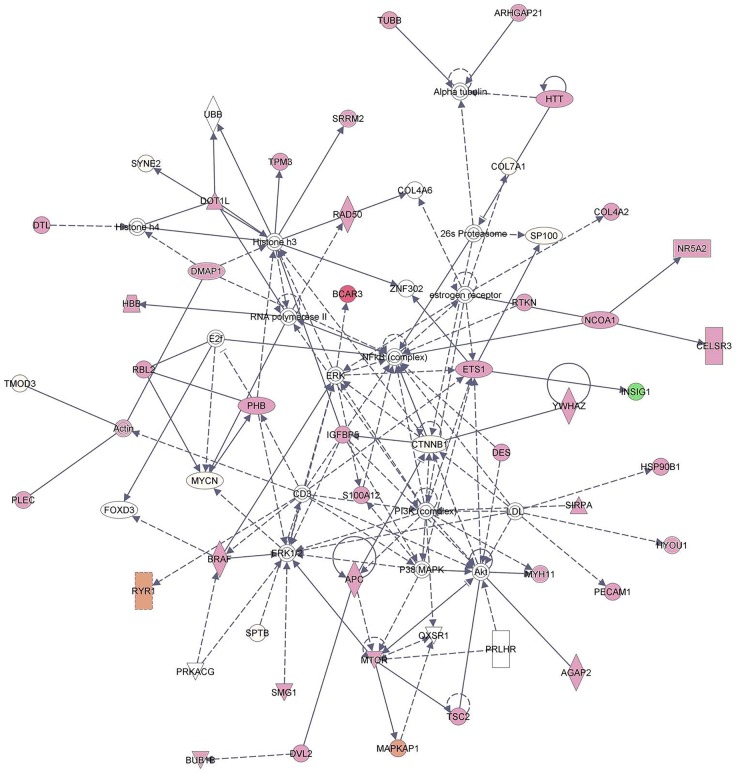
Figure 3. “Cell Death and Survival, Cancer, Gastrointestinal disease” network of 70 proteins observed de-regulated in tumoral prostate tissue by the iterative Ingenuity Pathway Analysis software program.
The node and edge represent the proteins and their interactions, respectively, while the intensity of the node color indicates degree of up- (red) or down- (green) regulation.

