
Figure 1. Non‐/slow‐growing cells and starved cells are antibiotic‐tolerant, accumulate ppGpp, and express TAS.
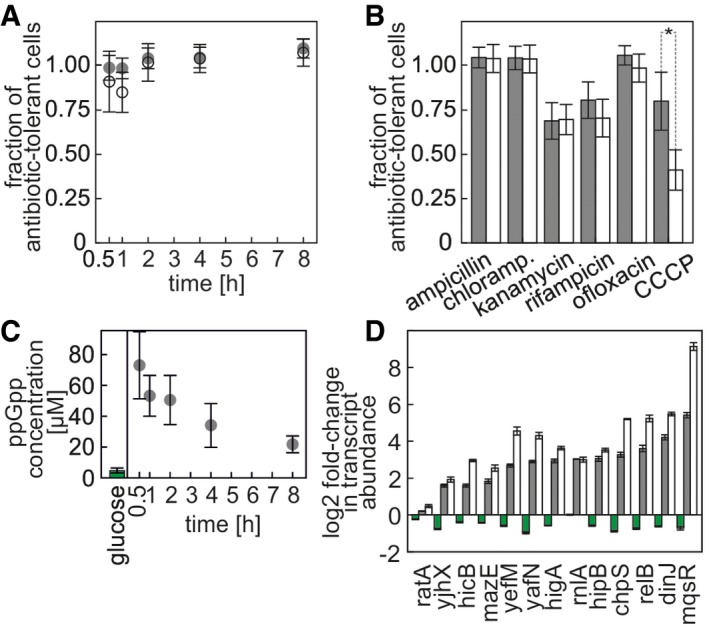
- Dynamics of establishing antibiotic tolerance during entry into non‐/slow growth or starvation. Fraction of antibiotic‐tolerant cells after treatment with ampicillin (2 h, 100 μg ml−1) is shown at various times after the medium switch. Gray disks: non‐/slow‐growing cells, open circles: starved cells. Data from biological triplicate. Error bars represent one standard deviation.
- Fractions of antibiotic‐tolerant cells after a 2‐h treatment of non‐/slow‐growing and starved cells with various antibiotics (ampicillin 100 μg ml−1; chloramphenicol 140 μg ml−1; kanamycin 100 μg ml−1; ofloxacin 5 μg ml−1; rifampicin 100 μg ml−1; CCCP 50 μg ml−1) 4 h after nutrient switch. Gray bars: non‐/slow‐growing cells, white bars: starved cells. Data from biological triplicate. Error bars represent one standard deviation. Statistical significance (t‐test or Wilcoxon rank sum test for kanamycin and ofloxacin, P‐value < 0.05) is marked with *.
- ppGpp concentration in cells growing on glucose and in cells shifted from glucose‐to‐fumarate medium. Data from biological triplicate. Error bars represent one standard deviation.
- Log2 fold change in transcript abundance of first genes in TAS operons compared to cells growing on glucose, normalized to housekeeping gene abundance. Green bars: 2 h after switch from glucose medium to glucose medium, gray bars: non‐/slow‐growing cells 2 h after switch from glucose medium to fumarate medium, white bars: starved cells 2 h after switch from glucose medium to medium without a carbon source. Data from triplicate experiments. Error bars represent one standard error of the mean.
Source data are available online for this figure.