
Figure 4. Persisters’ and starved cells’ proteome are shaped by the same cue.
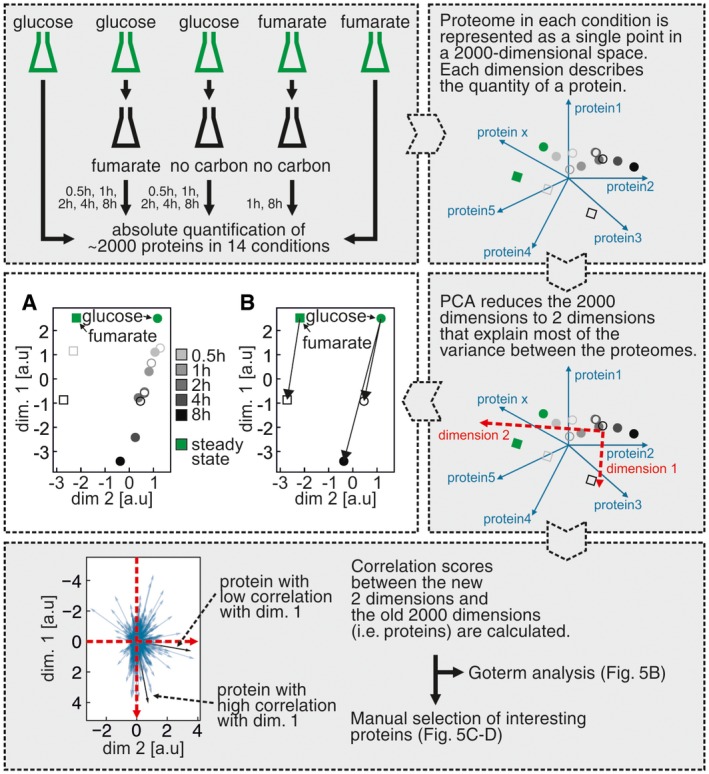
The experimental and data analysis procedure is described in the gray boxes step by step.
- PCA plot of the Escherichia coli proteomes in different conditions and time points. Each point represents a proteome in a different state. The distances between points are inversely correlated with the similarity between proteomes (i.e. proteomes with higher correlation coefficient have a shorter distance between each other), calculated based on differences in the expression level of each quantified protein. Green disk: cells growing on glucose, green square: cells growing on fumarate, gray disks: cells entering persistence after glucose‐to‐fumarate switch, open circles: cells entering starvation from glucose, open squares: cells entering starvation from fumarate. Time series are indicated by gray color gradients.
- The progression of changes upon entry into starvation and entry into persistence happens in the same direction in the two‐dimensional space, indicating that the same cue shapes these proteomes.